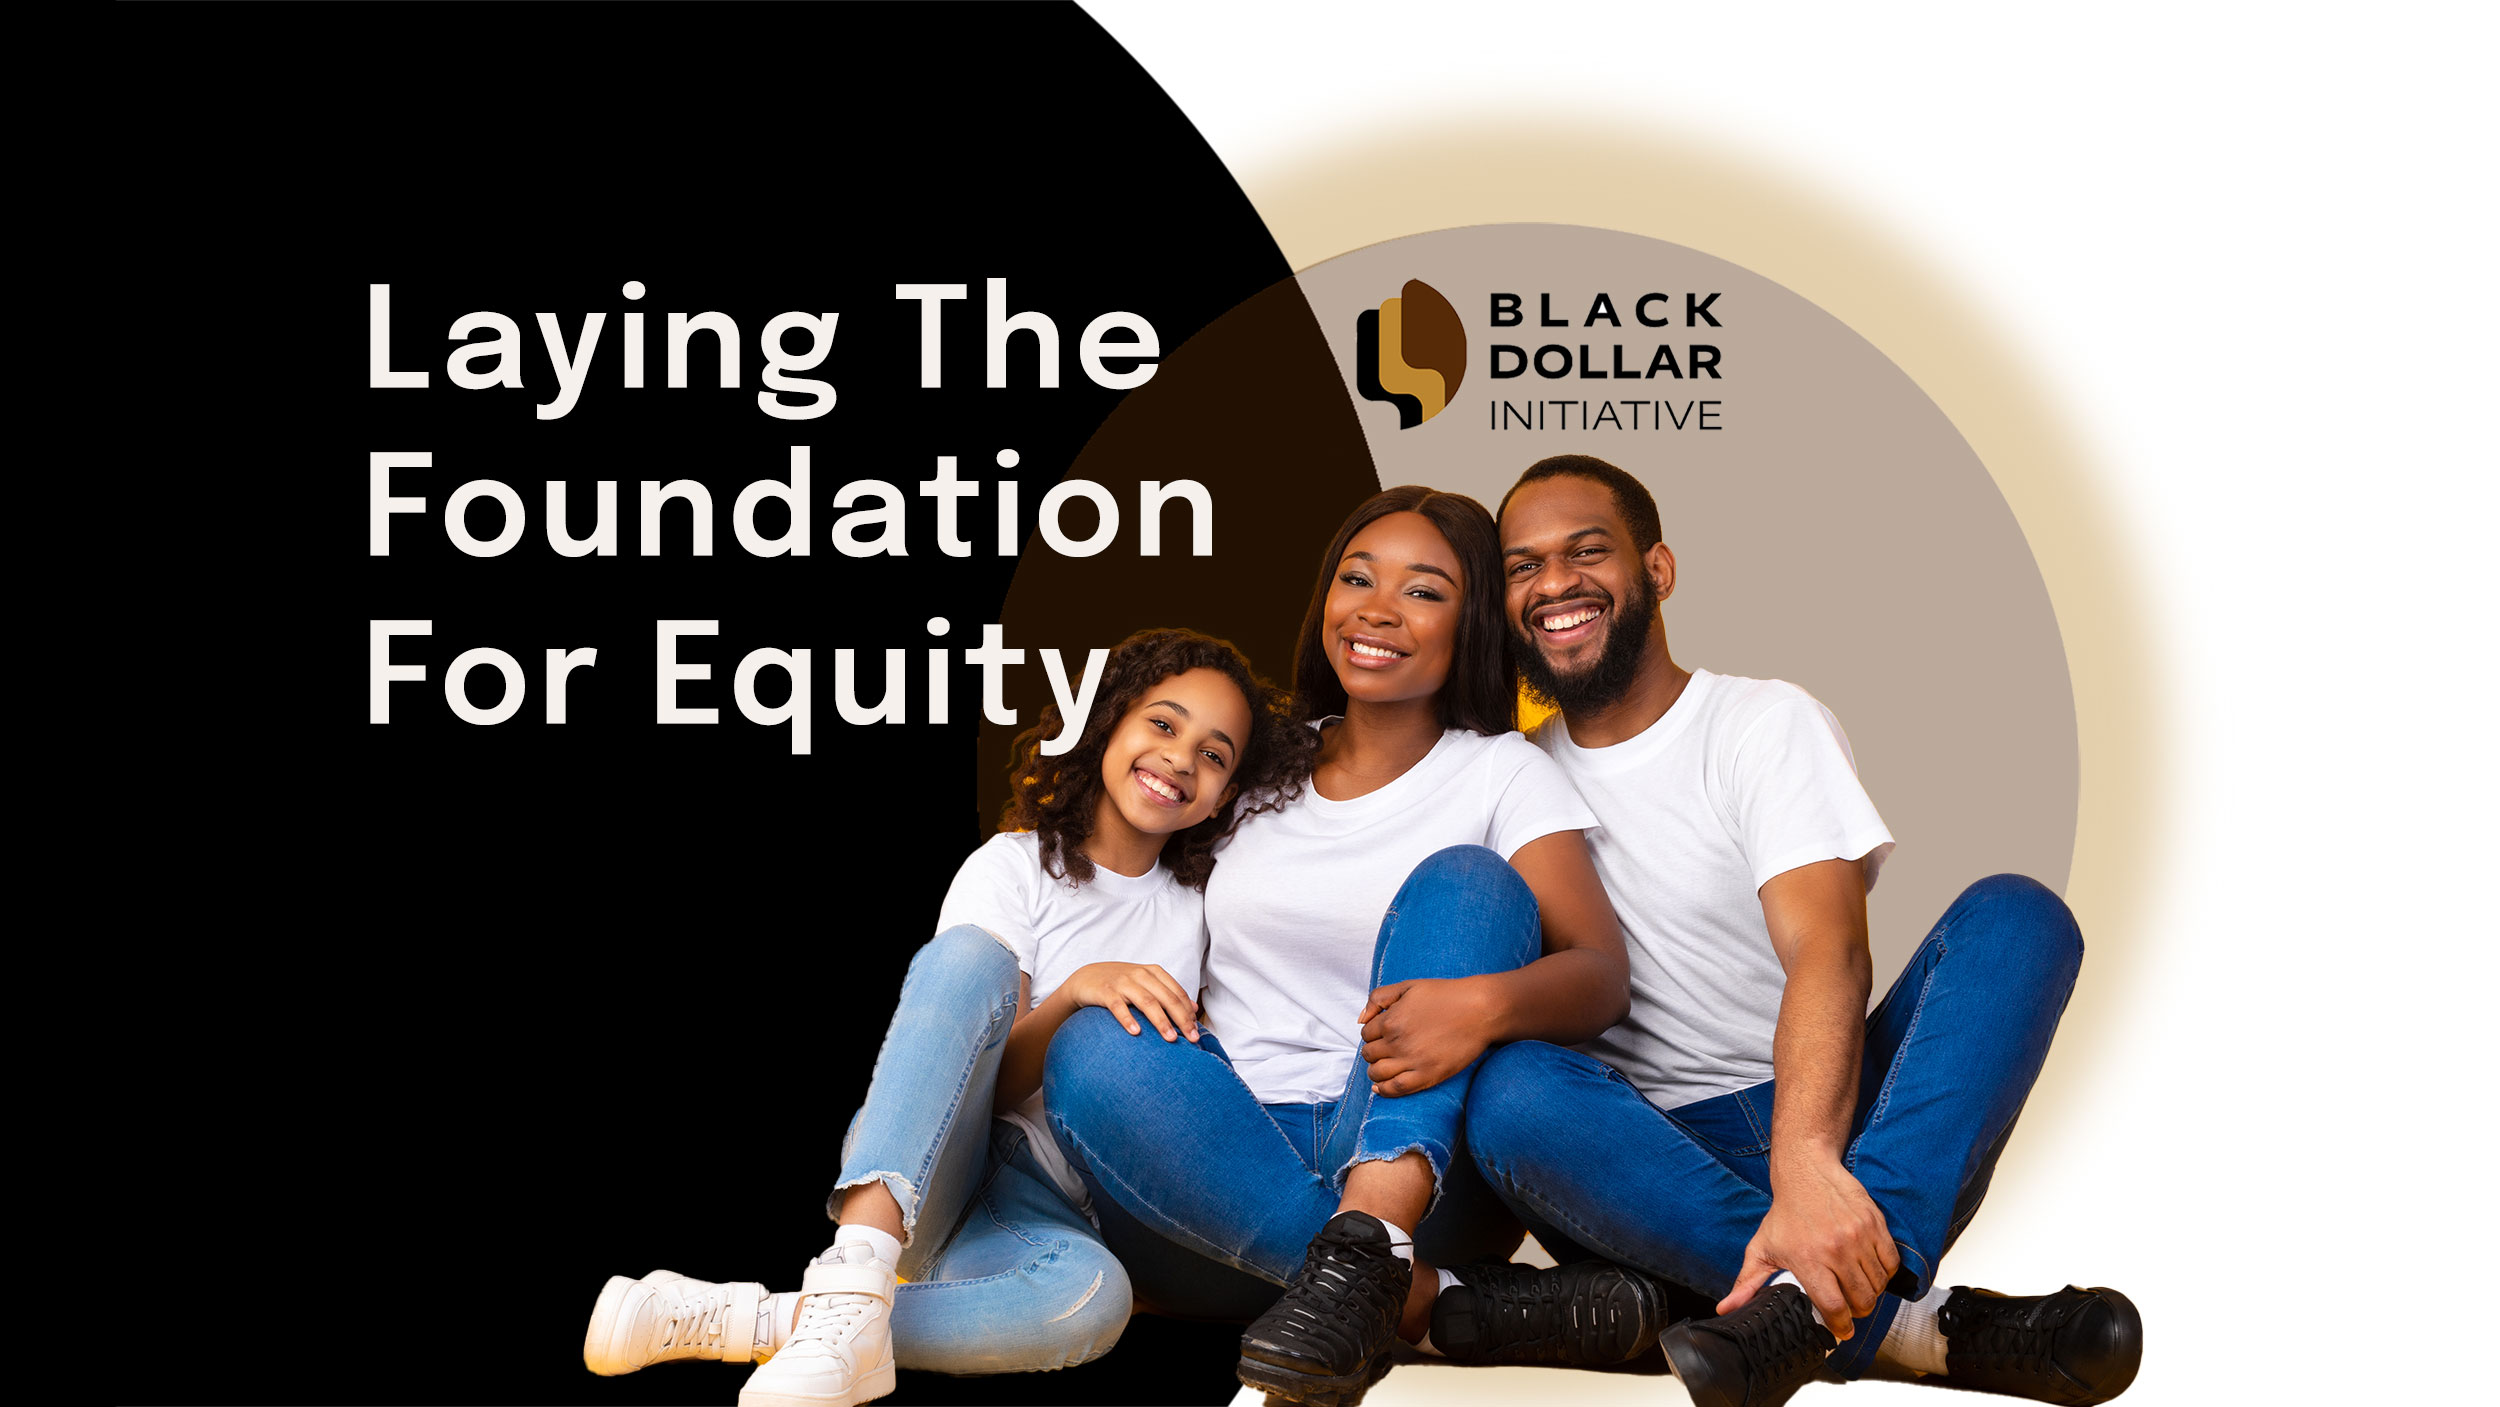
The Black Dollar Initiative is the independent non-profit data and research hub that powers the Black Dollar Index
OUR MISSION
Create a more equitable relationship between corporate America and Black communities.
OUR MISSION
Create a more equitable relationship between corporate America and Black communities.
WAYS TO USE THE DATA
Our data empowers professionals and consumers to drive equity, accountability, and impactful change.
Corporate Benchmarking: Assess your company’s DEI efforts relative to peers in their industry and identify areas for improvement.
Driving Internal Change: Advocate for stronger DEI initiatives, responsible marketing campaigns, and make the case for prioritizing racial equity as a core business strategy.
Developing Partnerships: Identify potential partnerships with companies excelling in racial equity practices or avoid collaborations with those falling short.
Informing Purchasing Decisions: Support companies actively investing in Black communities through their DEI initiatives, supplier diversity programs, and community investments.
Advocating for Accountability: Raise awareness on social media or within communities about brands that fail to meet racial equity benchmarks.
Building Community Power: Encourage collective action by sharing the data with friends, family, and community groups to amplify economic impact.
WAYS TO USE THE DATA
Our data empowers professionals and consumers to drive equity, accountability, and impactful change.
FOR PROFESSIONALS
Corporate Benchmarking
Corporate Benchmarking
Use the data to assess your company’s DEI efforts relative to peers in their industry and identify areas for improvement.
Driving Internal Change
Driving Internal Change
Leverage insights to advocate for stronger DEI initiatives, responsible marketing campaigns, and make the case for prioritizing racial equity as a core business strategy.
Developing Partnerships
Developing Partnerships
Identify potential partnerships with companies excelling in racial equity practices or avoid collaborations with those falling short.
FOR CONSUMERS
Informing Purchasing Decisions
Informing Purchasing Decisions
Support companies actively investing in Black communities through their DEI initiatives, supplier diversity programs, and community investments.
Advocating for Accountability
Advocating for Accountability
Raise awareness on social media or within communities about brands that fail to meet racial equity benchmarks.
Building Community Power
Building Community Power
Encourage collective action by sharing the data with friends, family, and community groups to amplify economic impact.
SUPPORT THE INITIATIVE
SUPPORT THE INITIATIVE
RESEARCH & REPORTS
CORPORATE BLACK EQUITY DATA
The Black Dollar Initiative researches Black equity data from top consumer-facing corporations across multiple points of impact that reflect Black Representation, Supplier Diversity, DEI Initiatives, Community Investments, and Racial Discrimination Claims.
The data below is from fiscal years 2023-2024 and will continue to be updated as corporations begin publishing reports in 2025. When exploring representation data, please note, the Black Population (US) = 13.7%.
The information presented in this report is based on publicly available data, corporate disclosures, and third-party sources. While Black Dollar Initiative (BDI) strives for accuracy and thorough validation, we cannot guarantee the completeness or accuracy of self-reported corporate data. Companies may update or change their reporting methodologies, and discrepancies may exist across different sources. BDI remains committed to transparency, accountability, and continuous refinement of our evaluation process.
| Company Name | Sub-Brands | Date Updated | Eliminated Key DEI Iniatives | Total Black Employees % (US) | Black Mid-Level/First Managers % | Black Executive/Senior Level Officials & Managers % | Black Corporate Leadership % | Black Board of Directors % | Black CEO | Supplier Diversity Program | Supplier Development | Tier 1 Supplier Diversity Spend | Black Supplier Spend | % Black Supplier Spend | Minimum Estimated Black Community Investments | Racial Pay Equity | Black Recruitment Strategy | Black Employee Resource Group | TBD | Skills-First Hiring (OneTen Coalition) | 2023-2025 Racial Discrimination Claims | Highlight 1 | Highlight 2 | Highlight 3 | Highlight 4 | Highlight 5 | 2024 ESG Report | Publish Date | 2023 ESG Report | Diversity Report |
|---|---|---|---|---|---|---|---|---|---|---|---|---|---|---|---|---|---|---|---|---|---|---|---|---|---|---|---|---|---|---|
| Adidas Group | Adidas | 0.0 | 0.0 | 200.0 | 25.0 | 6.3 | No | Yes | 0 | 0 | Not Reported | 0 | Not Reported | Not Reported | Progressive Soles | No | A top Adidas executive received a “final warning” over repeated “inappropriate and unacceptable” remarks about diversity. | United Against Racism: An initiative launched in 2020 to support the social justice movement and to promote racial equity within our US business and communities. The commitments include, among others, an investment of US 120 million in the US toward ending racism and supporting Black communities through to 2025 as well as funding for 55 university scholarships in the US each year for Black and LatinX students. | Valence Partnership: Partnered with Valence, a digital community committed to elevating Black professionals in the workplace. A mentorship program for emerging Black leaders supports them in reaching their goals through coaching, community and a MasterClass curriculum. | Donated $139,547 in a Employee/Company Match program that supported “ Ukraine and other broad issue areas, including Civil Rights. Dedicated amount to Black Civil Rights not reported. | BeyGOOD: 1000 grants for Black-owned small businesses as part of‘BeyGOOD,’ an initiative aimed at bringing equity to thosedisproportionately impacted by social and racial injustice | An undisclosed amount went to “32 funded ventures for ‘Black Ambition,’ a program that supports Black and LatinX entrepreneurs in launching start-upbusinesses.” | https://report.adidas-group.com/2023/en/group-management-report-our-company/sustainability/environmental-impacts.html | https://report.adidas-group.com/2023/en/group-management-report-our-company/sustainability/environmental-impacts.html | ||||||
| Ahold Delhaize | Food Lion, The Giant Company, Giant, Hannaford, Stop & Shop | 3/8/2025 | 21.2 | 0.0 | 200.0 | 0.0 | 0.0 | No | Yes | 0 | 0 | Not Reported | 0 | Not Reported | Not Reported | No | https://www.aholddelhaize.com/media/wcqil04n/ad_annual-report_2024_interactive.pdf | |||||||||||||
| Airbnb | Airbnb | 3/8/2025 | 5.4 | 0.0 | 4.5 | 0.0 | 22.2 | No | Yes | Not Reported | 0 | 0 | Not Reported | 0 | Yes | Not Reported | Black@ Airbnb | Yes | Deposited more than $50 million into Black-owned and women-owned banks such as First Women’s Bank. These funds are being utilized to support housing, small businesses, and other essential needs in low-to-moderate income communities. | Airbnb joined Operation HOPE’s 1 Million Black Businesses initiative. Together, Airbnb and Operation HOPE will promote the economic benefits of hosting and promote prospective and current hosts’ access to Operation HOPE’s financial services tools, which provide critical insight and guidance for individuals who are starting a business or exploring new ways to earn extra income. This builds on partnerships with NAACP and LULAC, among others. | To date, the Airbnb Entrepreneurship Academy has helped more than 4,500 participants from historically underrepresented communities in 12 countries learn how to host on Airbnb. We continue to scale the Academy; in 2024, we will partner with more than 30 organizations, including the Black BRAND, and Washington Area Community Investment Fund (Wacif) in the US. | As of December 31, 2023, 16.6 percent of the businesses in our US supply chain are diverse businesses, up from 14.3 percent as of the end of 2022 and up from 13.8 percent as of the end of 2021. We are working toward a goal of increasing the diverse-owned business representation in our US supply chain to 20 percent by year-end 2025. | Project Lighthouse: Project Lighthouse uses a first of its kind privacy-centric method to help Airbnb identify and work to eliminate disparities in how Black users and other people of color experience Airbnb. | https://s26.q4cdn.com/656283129/files/doc_downloads/governance_doc_updated/2024/12/Airbnb-2024-Sustainability-and-Community-Update.pdf | ||||||
| Albertsons Companies | Albertsons, Safeway, Vons, Jewel-Osco, Shaw's, Acme, Tom Thumb, Randalls, United Supermarkets, Pavilions, Star Market, Haggen, Carrs, Kings Food Markets, and Balducci's Food Lovers Market | 21.0 | 0.0 | 200.0 | 0.0 | 10.0 | No | 0 | 0 | Not Reported | 0 | African American Leadership Council | No | Black History Month: Jewel-Osco division hosted its annual Black History Month celebration which supported more than 35 local and minority-owned brands, while giving back to the community with in-store events and charitable donations from our Foundation. | ||||||||||||||||
| Allstate | Allstate | 20.4 | 10.1 | 7.0 | 0.0 | 23.1 | No | Yes | 386,000,000 | 0 | Not Reported | 1,600,000 | African American Working Network | Yes | In 2024, Allstate awarded 1.6 million in grants through the Main Street Grants program. This initiative supports small businesses and community organizations in Chicago’s South and West sides, focusing on fostering economic empowerment and revitalization in Black communities. These grants help businesses build capacity, create jobs, and drive community development | |||||||||||||||
| Amazon | One Medical, Whole Foods Market, 6pm, Zappos, Ring, Neighbors App, Shopbop, PillPack | Yes | 25.7 | 12.6 | 5.5 | 0.0 | 7.7 | No | Yes | 4,300,000,000 | 0 | Not Reported | 37,000,000 | Black Employee Network: Amazon's Black Employee Network's (BEN) mission is to recruit, retain, and empower Black employees. BEN connects members with mentors and provides career and personal development workshops. BEN also engages with the local and regional chapters of the National Society of Black Engineers, leads recruiting initiatives with Historically Black Colleges and Universities, and partners with other organizations. | No | Backed by a 150 million commitment from Amazon over four years, the Black Business Accelerator (BBA) is dedicated to assisting Black-owned businesses in building sustainable growth on Amazon’s store. It provides a range of comprehensive educational, discoverability, and community resources for certified Black-owned U.S. businesses with professional seller accounts at our store. In 2023, the BBA provided 274 businesses with account management and financial assistance to accelerate their journey to launch and scale their businesses. | https://assets.aboutamazon.com/64/79/d3746ef14fd99cc6be94532c9db5/2023-eeo1-amazon-report.pdf | |||||||||||||
| American Airlines | American Airlines | 19.9 | 17.8 | 7.7 | 11.1 | 16.7 | No | 0 | 0 | Not Reported | 0 | Black Professional Network | No | In 2023, the Cadet Academy expanded its training footprint by adding Luke Weathers Jr. Flight Academy in Olive Branch, Mississippi, which is run by the Organization of Black Aerospace Professionals (OBAP), as well as Infinity Flight Group in Trenton, New Jersey. | ||||||||||||||||
| American Express | American Express | 17.9 | 8.8 | 8.1 | 10.0 | 28.6 | No | Yes | 580,000,000 | 95,000,000 | 16.38% | 2,000,000 | #VALUE! | Yes | UNCF Building Better Future Grants: In October 2022, we announced a 2 million pledge from the American Express Foundation to United Negro College Fund (UNCF) to help advance opportunities for students in underrepresented communities. From 2023-2025, UNCF will use the funding to award 300 Building Better Futures grants of 5,000 each to students in their senior year at historically Black colleges and universities (HBCUs). These grants will support students as they look to transition into the next phase of their careers after graduation. Funding also supports UNCF’s existing K-12 Initiative, which promotes college readiness by educating and empowering parents, community leaders and students across the nation. | https://s26.q4cdn.com/747928648/files/doc_downloads/ESG/reporting-resources/2024/AXP_2023_2024_ESG_Report.pdf | ||||||||||||||
| Apple, Inc. | Apple | No - Board Recommends Shareholders Vote Against Anti-DEI Proposal on 2/25/25 | 8.2 | 3.2 | 1.5 | 5.0 | 12.5 | No | Yes | 1,000,000,000 | 0 | Not Reported | 91,000,000 | Black@Apple | Apple’s Racial Equity and Justice Initiative was launched in June 2020 to advance equity and expand access to opportunities for Black, Hispanic/Latinx, and Indigenous communities. We established the program with a 100 million commitment, and since then, we’ve more than doubled our commitment to over 200 million. This funding supports projects and partnerships across three priority areas: education, economic empowerment, and criminal justice reform. These are areas where we’ve historically seen disproportionate impacts for underresourced communities. | |||||||||||||||
| AT&T | 20.0 | 0.0 | 200.0 | 11.1 | 9.1 | No | Yes | 11,900,000,000 | 0 | Not Reported | 125,000 | The NETwork, Black Integrated Communications Professionals [BCIP]: promotes the African-American experience at AT&T and pursues inclusive opportunities to unite all who share our core values. We facilitate personal and professional growth and development for our members. | Yes | Dream In Black: A signature AT&T platform built in 2018 around the mindset that success can look like anything we can dream. | ||||||||||||||||
| Bank of America | Bank of America | 14.7 | 11.2 | 6.2 | 8.0 | 15.4 | No | Yes | 2,000,000,000 | 0 | Not Reported | 0 | Black Professional Group (BPG): BPG is committed to advancing the professional development of employees with ties to African American, West Indian, Caribbean and African heritages. The network focuses on recruiting new talent, retaining and promoting current employees and offering mentoring to help develop leadership potential. BPG also hosts a number of events throughout the year — live and virtual — to create awareness and encourage conversations about social and economic issues. | Yes | In May 2023, we announced the launch of the Bank of America Breakthrough LabTM impact accelerator, a six-month program that provides tailored mentorship, digital expertise, networking with industry experts and access to potential investors to Black/African American, Hispanic-Latino, Native American and other entrepreneurs so they can scale-up their technology-related businesses. | Students join us from more than 400 universities for entry-level opportunities through our highly competitive campus program. As part of our commitment to a diverse and inclusive workforce, we hired from more than 30 Hispanic-Serving Institutions and Historically Black Colleges and Universities. In addition, we’ve developed partnerships with 34 community colleges to collaborate on a career readiness curriculum for careers in financial services and connect to diverse talent. In addition, we work with more than 90 external partners, including nonprofit organizations, to help identify talent and expand our impact — including Road to Hire, UnidosUS, Urban Alliance, Year Up, the National Black MBA Association, Association of Latino Professionals for America, National Association of Asian American Professionals, Ascend, Vietnam Finance Society, The National Coalition for Asian Pacific American Community Development and The Asian American Foundation, Junior Achievement, Hiring Our Heroes, Disability:IN, Native American Finance Officers Association and Out & Equal. | Our portfolio includes $198 million in deposits in 21 MDIs and CDFI banks. We’ve also committed $44 million in equity to 24 MDIs and CDFI banks that provide lending and other banking services in U.S. minority communities. | https://investor.bankofamerica.com/regulatory-and-other-filings/annual-reports/content/0000070858-24-000135/0000070858-24-000135.pdf | https://about.bankofamerica.com/content/dam/about/report-center/esg/2023/2023-bank-of-america-reeo-examination.pdf | Check 2023 Annual Report | ||||||||||
| Suntory Global Spirits | Jim Beam, Maker's Mark, Midori, Roku, Effen, Pinnacle, Larios, Cruzan Rum, Hornitos, Sauza, Knob Creek, Basil Hayden, Hibiki, Canadian Club | 2/11/2025 | No | 0.0 | 0.0 | 200.0 | 0.0 | 0.0 | No | Yes | Not Reported | 0 | 0 | Not Reported | 0 | Not Reported | BoLD | No | We exhibited at the National Black MBA Association 45th Annual Conference & Exposition to showcase our employer brand, build leadership capabilities and recruit candidates. | In 2023, achieved 2.5% of global spend with diverse suppliers. | For the second consecutive year, we included Proof Positive sustainability metrics in our Annual Incentive Plan (AIP), holding our leaders and people accountable for achieving our goals. For 2023, our AIP metrics included water conservation, tree planting , and diversity, equity and inclusion with a 20% weighting. At 136%, we exceeded these metrics, with all leaders having a DEI goal and scoring two points higher than in 2022 on our ‘I can feel comfortable being myself at work’ metric in our engagement pulse survey. | https://www.suntoryglobalspirits.com/sites/default/files/Suntory_Global_Spirits_2023_SustainabilityReport.pdf | ||||||||
| Beyond Inc. | Bed Bath & Beyond, BuyBuy Baby, Overstock, Zulily | 2/11/2025 | 0.0 | 0.0 | 200.0 | 25.0 | 20.0 | No | Not Reported | Not Reported | 0 | 0 | Not Reported | 0 | Not Reported | Black Employee Network (b.e.n.) | No | 2023: Bed Bath & Beyond Employee Calls Police Over Black Couple's Shopping | ||||||||||||
| Best Buy | Best Buy | 15.1 | 7.1 | 7.7 | 13.3 | 9.1 | No | Yes | Yes | 0 | 0 | Not Reported | 0 | Black Employee Resource Group (BERG) | Since 2020, Best Buy and the Best Buy Foundation have allocated more than 19 million to expand college preparation and career opportunities for students from disinvested communities, increasing scholarship funding. We are working toward a goal of spending 44 million by 2025. | |||||||||||||||
| BJ's Wholesale | BJ's Wholesale, Berkley Jensen, Wellsley Farms | 2/4/2025 | 22.0 | 12.5 | 3.7 | 0.0 | 10.0 | No | Not Reported | Not Reported | 0 | 0 | Not Reported | 0 | Not Reported | Not Reported | No | https://www.bjs.com/biz/pdfs/sustainability/bjs-sustainability-and-governance-report-2023.pdf | https://www.bjs.com/biz/pdfs/sustainability/BJs_EEO1_2023-2.pdf | |||||||||||
| Ulta Beauty | Ulta Beauty | 3/3/2025 | 13.6 | 0.0 | 200.0 | 10.0 | 18.2 | No | Yes | Yes | 453,000,000 | 0 | Not Reported | 0 | Not Reported | Not Reported | Yes | No | Only 2022 EEO-1 Report Available, but they did report the following: - Regular Managerial Employees: 9.3% Black - Regular Non-Managerial Employees: 13.2% | As of the end of fiscal 2023, Black-owned, -founded and -led brands made up ~9% of our brand assortment store-wide. | Spent $193M with certified minority-owned businesses | Welcomed the second cohort of our MUSE Accelerator program, a 10-week program designed to prepare early-stage BIPOC-owned and -founded brands for retail readiness. | The Ulta Beauty Charitable Foundation donated $2 million in 2024 to nonprofit partners focused on BIPOC and LGBTQ+ communities. | https://d1io3yog0oux5.cloudfront.net/_d0e19df215dd3c194eba38db1b0655aa/ulta/files/pages/ulta/db/1975/description/Ulta_Beauty_2023_ESG_Report_Final_ADA_vF.pdf | ||||||
| New Balance | Brine, Warrior, NBTeamSports | 3/5/2025 | 10.4 | 0.0 | 1.6 | 0.0 | 200.0 | No | Not Reported | Not Reported | 0 | 0 | Not Reported | 0 | Not Reported | Pensole Lewis | Black Soles | No | None Found | We collaborate with Pensole Lewis (HBCU) each year on “Designing with Sole,” a hands-on intensive design program to broaden career pathways for underrepresented groups in our industry. Since the initial cohort, more than 225 participants have taken part in this five-week program in which they undertake a product creation process. The program focuses on footwear and apparel design, color and materials, and brand marketing. Participants learn from New Balance associates who interact and share their knowledge, guiding and challenging participants to achieve their highest creative potential. | Gradifi®, a student loan paydown program for eligible associates to receive up to $100 per month in matching loan payments. | New Balance ambassadors Jaden Smith and Harry Hudson joined more than 550 associates at The Track for an afternoon of bike building to benefit Boston area kids at the Greater Boston YMCA in Roxbury, Massachusetts. With the help of Team Bonding, a corporate event planning company headquartered in Boston, 110 bikes were built and delivered the same day to the kids in Roxbury | https://www.newbalance.com/on/demandware.static/-/Library-Sites-NBUS-NBCA/default/dw87610e36/pdf/New_Balance_Sustainability_and_Impact_Report_2023.pdf | |||||||
| Bloomin Brands | Outback Steakhouse, Carrabbas Italian Grill, Bonefish Grill, Fleming's Prime Steahouse & Wine Bar | 2/4/2025 | No | 17.1 | 0.0 | 200.0 | 8.3 | 10.0 | No | Not Reported | Not Reported | 0 | 0 | Not Reported | 670,000 | Yes | BIG: To attract, nurture, and amplify Black talent at Bloomin' Brands | No | None Found | In 2020, we launched a five-year partnership, totaling $1.25 million, with the Urban League to support social justice and anti-discrimination that will include participation opportunities for Team Members across the country | Booker T. Washington Elementary — The BIG ERG has established an ongoing partnership with Booker T. Washington Elementary School, providing support and service to students, teachers, and families. Activities include coordinating Back to School and Holiday Toy Drives, feeding teachers for Teacher Appreciation Week and honoring Juneteenth with community service at the school. | The Ulta Beauty Charitable Foundation donated $2 million in 2024 to nonprofit partners focused on BIPOC and LGBTQ+ communities. | https://www.bloominbrands.com/docs/default-source/default-document-library/2023-impact-report.pdf | |||||||
| BP | 8.0 | 8.0 | 6.0 | 10.0 | 0.0 | No | Yes | Yes | 468,000,000 | 0 | Not Reported | 4,050,000 | Yes | Yes | No | None Found | In the US, we fund the ACCEL programme, a partnership of Greentown Labs and Browning the Green Space. It supports founders of companies who are Black, Indigenous or people of colour and whose companies address climate change, promote diversity and advocate for the use of lower carbon technologies in under-served communities. In 2023 the inaugural ACCEL cohort of six start-ups received grant funding, training, and mentorship by industry experts. | Continued our 12-month Leadership Inclusion for Talent (LIfT) development programme for under-represented minority talent in the US and UK, which was completed by nearly 40 Black heritage employees. Our trading & shipping entity ran a programme for women in leadership and we also made plans for a new intake of Asian heritage employees across bp in 2024. | bp HBCU Fellowship Program bp announced an investment of $4.05 million to three historically Black colleges and universities (HBCUs) that will provide students with scholarship funding, as well as skills and career development. As part of the new bp HBCU Fellowship Program, Florida A&M (Agricultural and Mechanical) University, North Carolina A&T (Agricultural and Technical) State University, and Prairie View A&M University will receive $1.35 million each to fund five full scholarships per year for three years, a total of 45 full scholarships. | Delivered Race4Equity training to almost 100% of our most senior leaders (group and senior leaders) and 84% of all other employees – this training is mandatory in the US and UK. | https://www.bp.com/content/dam/bp/business-sites/en/global/corporate/pdfs/sustainability/group-reports/bp-sustainability-report-2023.pdf | https://www.bp.com/content/dam/bp/business-sites/en/global/corporate/pdfs/sustainability/group-reports/bp-diversity-equity-and-inclusion-report-2023.pdf | ||||||||
| Brinker International | Chili’s Grill & Bar, Maggiano’s Little Italy, It's Just Wings | 2/13/2025 | 14.9 | 11.4 | 3.7 | 0.0 | 10.0 | No | Not Reported | Not Reported | 0 | 0 | Not Reported | 0 | Not Reported | Not Reported | No | 2023: Denver Chili’s refused to serve Black family unless they paid in advance, lawsuit alleges Decided May 2024: Lawsuit accuses restaurant of refusing African American woman an open table shortly before offering it to a white patron, who turned out to be her fiancé. | Established a partnership with Bonton Farms, an urban farm in South Dallas, to support their mission of restoring lives, creating jobs and igniting hope in a once-forgotten neighborhood with some of the most marginalized people. More information coming soon. | https://brinker-qa.cdn.prismic.io/brinker-qa/ZvR38rVsGrYSwAqO_Brinker_Sustainability_Report_2024_v10.2_FINAL.pdf | ||||||||||
| Capital One | Capital One | 2/13/2025 | 16.7 | 5.9 | 5.5 | 200.0 | 25.0 | No | Yes | Yes | 677,000,000 | 0 | Not Reported | Yes | Voices | No | 2023: Capital One will not receive further deposits from the City of New York after an unprecedented public vote by the New York City Banking Commission, which took the punitive action because the banks have refused to share information on their internal efforts to combat discrimination. | The Mentoring Program: A program that provides educational courses and matches Black and Hispanic-owned businesses with Capital One associate mentors for a four-month mentoring relationship. | Partnered with HBCUs: Florida International University, Xavier University, Southern University and A&M College, Spelman College, Howard University, Delaware State University, North Carolina A&T, FAMU, Prairie View A&M University, Paul Quinn College. | https://ecm.capitalone.com/WCM/stories/pdfs/2023-capital-one-environmental-social-and-governance-report.pdf?external_id=Our-Commitments | ||||||||||
| The Cheesecake Factory | The Cheesecake Factory | 2/13/2025 | 16.3 | 13.3 | 3.9 | 0.0 | 0.0 | No | Not Reported | Not Reported | 0 | 0 | Not Reported | 0 | Not Reported | Not Reported | No | 2023: The Illinois Human Rights Commission found evidence of racial discrimination at The Cheesecake Factory, citing unequal treatment, pay disparities, and a revived wrongful termination claim for a Black employee. | https://thecheesecakefactory-nomnom-drupal-prod.s3.amazonaws.com/s3fs-public/2024-05/2023-csr-report-the-cheesecake-factory.pdf | https://www.thecheesecakefactory.com/sites/default/files/2024-04/eeo-1-data-2023-tcf.pdf | ||||||||||
| Chevron | Chevron | 2/13/2025 | 8.0 | 7.1 | 5.3 | 5.6 | 16.7 | No | Yes | Not Reported | 600,000,000 | 0 | Not Reported | 0 | Yes | Black Employee Network | No | 2023: A Black employee at the Chevron Pascagoula refinery says he’s spent decades as a mechanic, training white employees who went on to management jobs that he was denied because of the color of his skin. | Chevron actively recruits interns and employees from historically Black colleges and universities. Since 2022, 50 students have accepted internships and 17 have accepted full-time positions. | In 2023, Chevron and Fab Foundation partnered with two historically black universities, Fort Valley State University, and Florida Agricultural and Mechanical University. The partnership delivered digital fabrication programs and equipment to communities in middle Georgia and Tallahassee, Florida. This included Fab Labs, small scale workshops equipped with a suite of digital fabrication and rapid prototyping machines such as 3-D printers. | Through a four-year agreement with the Executive Leadership Council, Chevron has sponsored leadership development training for over 135 employees, with nearly 40 attending in 2023. | https://www.chevron.com/-/media/shared-media/documents/chevron-sustainability-report-2023.pdf | https://www.chevron.com/-/media/chevron/sustainability/documents/eeo1.pdf | |||||||
| Chick-Fil-a | Chick-Fil-a | 2/13/2025 | 0.0 | 0.0 | 200.0 | 200.0 | 200.0 | No | Not Reported | Not Reported | 0 | 0 | Not Reported | 14,000,000 | Yes | Black Employee Resource Group (BERG) | No | 2024: Black Man says Chick-fil-A printed racial slur on meal label instead of name The Charles County man says the label he received had the word "monkeys" printed instead of his name. | Working with Atlanta’s Morris Brown College, the only historically Black college to launch an on-campus hospitality management training program committed to preparing Black and Brown people to own and operate restaurants and hotels. “Our $1 million gift for a leadership development program will give students access to opportunities and tools to help them advance their skills, network and prepare for success in their college journey, business and life,” said Chick-fil-A Director of Community Affairs and Corporate Social Responsibility Carol Waddy. | In 2023, Chick-Fil-A committed to the following Atlanta-area organizations: • Atlanta Community Food Bank — $1.5 million • Boys and Girls Clubs of Metro Atlanta — $1 million • City of Refuge — $4.5 million • Clark Atlanta University — $1 million • Westside Future Fund — $5 million | Team Member, Malcolm Jones of Chick-fil-A Wilson in Wilson, North Carolina, received the $50,000 Eddie White Servant Leadership Award. This one-time award – the largest in Chick-fil-A’s history – is named for our first scholarship recipient and given in honor of the 50th anniversary of scholarship giving at Chick-fil-A. | https://d1fd34dzzl09j.cloudfront.net/2024%20Global%20Impact%20Report%20PDF/2023%20Chick-fil-A%20Global%20Impact%20Report_Accessible%20PDF%20File%20Download_05-13-24.pdf | ||||||||
| Citigroup | Citi Bank | 2/13/2025 | 11.5 | 0.0 | 3.7 | 5.6 | 14.3 | No | Yes | Yes | 1,100,000,000 | 446,000,000 | 40.55% | 333,333,333 | Yes | Black Heritage Network | No | In 2023, Citi and the Citi Foundation continued to advance Action for Racial Equity, a threeyear, $1 billion commitment to pursue a range of business and philanthropic initiatives designed to help increase financial inclusion and close the racial wealth gap in the U.S. and support our mission to enable economic growth and progress. Met and exceeded goal. | 29% Black and Hispanic/Latino representation in full-time analyst and associate roles (2023) 30% Black and Hispanic/Latino representation in the summer analyst and associate programs (2023) | Black and Hispanic Leadership Journey: This immersive program for Assistant Vice Presidents across U.S. Personal Banking and Wealth provides development through sessions and coaching on personal brand, confidence, organizational savvy and the challenges facing diverse leaders. The program also engages participants’ managers. | Black Leaders for Tomorrow, for our Banking and Markets business, offers an advocacy program for Directors. | https://www.citigroup.com/rcs/citigpa/storage/public/Global-ESG-Report-2023.pdf | ||||||||
| Clorox | Clorox, Chux, Liquid-Plumr, Pine-Sol, Poett, Brita, Fresh Step, Glad, Hidden Valley Ranch, Kingsford, Burt's Bees | 2/13/2025 | 17.1 | 9.2 | 12.5 | 21.4 | 18.2 | No | Yes | Not Reported | 202,800,000 | 0 | Not Reported | 60,000 | No | To support the rich tradition of barbecue in the Black community while helping invest in its future, Kingsford continued its Preserve the Pit Fellowship program. The fellowship program gave a select group of barbecue professionals an opportunity for one-on-one mentorship with dedicated industry leaders. They gained skills and received helpful advice from their mentors and received grants to support the growth of their businesses. | Clorox and Burt’s Bees donated $25,000 to North Carolina Central University’s Center for Entrepreneurship and Economic Development. The donation supports the center’s mission to foster a culture of creativity and innovation among students, faculty and staff at NCCU and the broader community to spur entrepreneurship and economic development. | The Clorox brand donated $35,000 to the Social Change Fund United to help support the organization’s work in building resources for HBCUs and underserved communities as well as creating access to anti-racism education. | https://s204.q4cdn.com/178752512/files/doc_financials/2024/ar/Clorox-FY24-Integrated-Annual-Report.pdf | https://cdn.metrio.net/clients/clorox/indicator_assets/esg_frameworks_and_reports_ind/EMPLOYER%20INFORMATION%20REPORT%20(EEO-1%20COMPONENT%201)-01.15.25.pdf | ||||||||||
| Coca Cola | Adés, Appletiser, Aquarius, Barq's, BodyArmor, Ciel, Costa Coffee, Dasani, del Valle, Dogadan, fairlife, Fanta, Fresca, Fuze, Georgia Coffee, Gold Peak Real Brewed Tea, Minute Maid, Peace Tea, Powerade, Schweppes, Simply, Smartwater, Sprite, Topo Chico, Vitaminwater | 20.1 | 12.3 | 4.1 | 5.3 | 9.1 | No | Yes | 0 | 0 | Not Reported | 3,200,000 | No | https://www.coca-colacompany.com/content/dam/company/us/en/reports/2023-data-updates/2023-workplace-representation-update.pdf | ||||||||||||||||
| Colgate-Palmolive | Colgate, Softsoap, Hill's, Speestick, Suavitel, Murphy Oil Soap, Irish Spring, Palmolive, Tom's of Maine, Ajax, Fleecy, Fabuloso, Hello, PCA Skin, Filorga, EltaMD Skin Care | 2/13/2025 | 9.0 | 0.0 | 6.0 | 4.2 | 20.0 | No | Yes | Yes | 200,000,000 | 0 | Not Reported | 0 | Black Leadership Network | No | Leading up to NYC Climate Week, they hosted a webinar in collaboration with the Black Leadership Network, about the intersection of black leadership and environmental and social justice. | 13.2% of their Diverse Suppliers are Black | https://www.colgatepalmolive.com/content/dam/cp-sites/corporate/corporate/common/pdf/sustainability/colgate-palmolive-sustainability-and-social-impact-final-report-2023.pdf | https://www.colgatepalmolive.com/content/dam/cp-sites/corporate/corporate/common/pdf/colgate-palmolive-diversity-equity-and-inclusion-report-for-2023.pdf | ||||||||||
| Comcast | Xfinity, NBCUniversal | 2/13/2025 | 16.4 | 9.9 | 8.0 | 14.3 | 30.0 | No | Yes | Not Reported | 4,700,000,000 | 0 | Not Reported | Black Employee Network | No | Per Scholas, which provides tech training to adult learners, we are helping to scale the organization in 15 markets. Since 2021, our support has helped 5,686 learners get jobs and created $320 million in economic impact. | https://update.comcast.com/wp-content/uploads/dlm_uploads/2024/06/Comcast-2024ImpactReport-Final-1.pdf | https://cmcsa.gcs-web.com/static-files/1d6d3ef6-d2d4-4c13-b452-7917b90e0032 | ||||||||||||
| Costco Wholesale | Kirkland Signature | 2/13/2025 | 9.3 | 8.3 | 2.3 | 0.0 | 9.1 | No | Yes | Not Reported | 0 | 0 | Not Reported | 70,000,000 | No | 25 million committed to the Black Economic Development Fund (BEDF), managed by Local Initiatives Support Corporation (LISC) Fund Management. The primary objective of the BEDF is to improve capital access for financial institutions, developers, businesses and anchor institutions that incentivize economic activity and wealth-building opportunities in Black communities across America. | ||||||||||||||
| Cracker Barrel | 2/13/2025 | 0.0 | 0.0 | 200.0 | 10.0 | 10.0 | No | Yes | Not Reported | 0 | 0 | Not Reported | 0 | No | In FY 2024, our team focused on providing meals to the unhoused in partnership with Historically Black Colleges and Universities (HBCUs) and continued to conduct workshops to introduce students to career opportunities at Cracker Barrel during a threehour skill development session teaching skills on applying for a job, resumé writing, and how to evaluate a job offer | https://investor.crackerbarrel.com/static-files/8cf9a15f-ccbd-444e-a6ec-e1f605b990ad | ||||||||||||||
| CVS Health | 2/13/2025 | 18.0 | 14.9 | 5.1 | 0.0 | 8.3 | No | Yes | Not Reported | 4,000,000,000 | 0 | Not Reported | 6,600,000 | Yes | Black Colleague Resource Group (BCRG) | No | (Black) Maternal Mortality Rate: $4 million over five years to the March of Dimes to diversify the doula workforce and educate consumers and providers on the benefits of doula care in six communities nationwide. | (Black) Maternal Mortality Rate: $1 million CVS Health® Foundation two-year program with the American Heart Association to connect birthing patients and care providers with hypertension education, monitoring and treatment in Hampton Roads, Virginia and Orlando, Florida. | (Black) Maternal Mortality Rate: $1.6 million to Mass General Brigham to implement a three-year program delivering maternal health services through a mobile van and increasing access to doula care. | In 2023, diverse suppliers represented 19.5% of our sourceable procurement spend | Collaborated with 82 Historically Black Colleges and Universities (HBCUs) | https://www.cvshealth.com/content/dam/enterprise/cvs-enterprise/pdfs/2023/Healthy-2030-Impact-Report.pdf | https://www.cvshealth.com/content/dam/enterprise/cvs-enterprise/pdfs/2024/CVS-Health-EEO-1-Consolidated-Report_2023.pdf | |||||||
| Darden Restaurants | Olive Garden Italian Kitchen, Longhorn Steakhouse, Yard House, Ruth's Chris Steak House, Cheddar's Scratch Kitchen, The Capital Grille, Chuy's, Seasons 52, Eddie V's Prime Seafood, Bahama Breeze Island Grille | 2/14/0205 | 15.1 | 11.3 | 2.9 | 0.0 | 0.0 | No | Yes | Not Reported | 0 | 0 | Not Reported | 500,000 | Not Reported | African American Network | No | In fiscal 2024, the Darden Foundation provided $500,000 to support the development and implementation of the Youth for Unity training curriculum, which provides dynamic experiences and activities focused on combating racism and promoting equity. The curriculum will help foster the next generation of leaders, problem-solvers and advocates for change. | The Darden Foundation contributes $250,000 annually to support NRAEF’s core programs: Scholarships focus on supporting women, racial/ ethnic minorities and first-generation students who are pursuing degrees in the industry. For the 2023-2024 school year, part of Darden’s annual contribution helped to support a scholarship program that awarded $1 million in scholarships ranging from $2,500 to $10,000. | NRAEF: Restaurant Ready is a growing national program that currently partners with 75 communitybased organizations that serve people who have historically faced barriers to opportunity. Restaurant Ready helps people acquire basic job and life skills and provides access to local restaurant and hospitality employers along with wrap-around services to support success. | Darden Impact Report 2024 | Downloaded | ||||||||
| Dell Technologies | 2/14/2025 | 6.3 | 4.1 | 3.7 | 0.0 | 12.5 | No | Yes | Yes | 3,000,000,000 | 0 | Not Reported | 0 | Yes | Black Networking Alliance | No | Currently, 17 of the schools participating in the AI for Workforce program are classified by the U.S. Department of Education as Minority Serving Institutions. This new partnership will focus on minority serving institutions and Tribal colleges to support under-resourced communities. We are committed to continual growth of this program. | Introducing students to tech: We partner with select HBCUs, minority-serving institutions, Hispanic-serving institutions and community colleges to take learning beyond the classroom with immersive and engaging in-person workshops on topics like sales engineering, cybersecurity and data science. | Offering our Dell Intern Scholars program: The Dell Technologies Intern Scholars Program is a multi-year internship experience for students who self-identify as Black/African American and/or Hispanic/Latino and who study computer science, supply chain, business, marketing or engineering. This program provides students the opportunity to build soft skills as well as business acumen through various learning and development programming. | https://www.dell.com/en-us/dt/corporate/social-impact/esg-resources/reports/fy24-esg-report.htm | https://www.dell.com/en-us/dt/corporate/social-impact/cultivating-inclusion/accountability.htm#pdf-overlay=//www.delltechnologies.com/asset/en-us/solutions/business-solutions/legal-pricing/eeo-1-disclosure.pdf | |||||||||
| Delta Airlines | Delta | 2/15/2025 | 26.8 | 20.8 | 8.5 | 0.0 | 14.3 | No | Yes | Not Reported | 2,000,000,000 | 559,000,000 | 27.95% | 3,600,000 | Yes | BOLD | Yes | Delta provides $1.6 million in financial aid annually to the UNCF, including $1 million for Emergency Retention Grants and Degree Completion Aid and $600,000 for HBCU scholarships. | The Delta Air Lines Foundation has awarded $2 million to the Arts at Spelman College to integrate the arts into STEM programs | Sponsored blood drives at 24 HBCUs to support the Red Cross HBCU Ambassador Leadership Program, which engages students in the Sickle Cell Initiative to help save lives through blood collection on HBCU campuses. | Elizabeth City State University in North Carolina recently became the second HBCU to join Delta’s Propel Collegiate Pilot Career Path Program. The program provides students from 16 post-secondary institutions with a defined, accelerated path to becoming a Delta pilot. Upon selection to the program, students receive a qualified job offer for a pilot position at Delta. | Engaging policy leaders on issues impacting the Black community at the annual legislative conference of the Congressional Black Caucus Foundation in Washington, D.C. | https://esghub.delta.com/content/dam/esg/2023/pdf/Delta-2023-ESG-Report.pdf | https://www.delta.com/content/dam/delta-www/about-delta/corporate-responsibility/2023-dal-certified-consolidated-eeo-1-report.pdf | ||||||
| Denny's | 2/15/2025 | 13.5 | 16.4 | 12.7 | 20.0 | 33.3 | No | Yes | Not Reported | 0 | 0 | 54.00% | 10,000 | African American Leadership Group | No | Denny’s Hungry for Education Scholarship Program partners with AKA, 100 Black Men of Upstate SC, Inc., Meharry Medical College, The Tom Joyner Foundation, Greater Spartanburg Divine Nine, National Urban League. Presented National Urban League with $10,000 at the Martha's Vineyard Comedy Fest. | Denny’s Hungry for Education Recruitment Tour has proven an excellent way to connect the Denny’s brand with opportunities in the African-American/HBCU community, as well as the Latino [Latinx community], in order to achieve our vision of a strong, healthy, more equitable environment for high achieving employees as well as allies and guests from diverse backgrounds. | 54% of Supplier Diversity Spend to Black Suppliers | 4% of Denny's franchises are Black-owned | https://online.fliphtml5.com/mmlqm/srqa/#p=1 | ||||||||||
| Diageo | Johnnie Walker, Guinness, Tanqueray, Baileys, Smirnoff, Captain Morgan, Crown Royal, Don Julio, Ciroc Vodka, Buchanan's, Casamigos, J&B, Ketel One Vodka, Mr. Black | 2/15/2025 | 0.0 | 0.0 | 200.0 | 7.7 | 11.1 | No | Yes | Not Reported | 883,000,000 | 0 | Not Reported | 400,000 | Yes | AHEAD (African Heritage Employees at Diageo) | No | In addition to celebrating Homecoming and Classic season at HBCUs, Diageo's support via endowments at 29 HBCUs across the country continues to provide financial support to future leaders (unlike grants, endowments provide a permanent stream of interest capital for scholarships). In 2023, interest from these endowments generated over $400,000 in scholarship funds distributed to future leaders, supporting their academic journeys. | https://www.diageo.com/~/media/Files/D/Diageo-V2/Diageo-Corp/investors/results-reports-and-events/annual-reports/diageo-annual-report-2024.pdf | |||||||||||
| Dine Brands | Applebee's Grill + Bar, Fuzzy's Taco Shop, IHOP | 2/15/2025 | 0.0 | 0.0 | 8.0 | 9.1 | 10.0 | No | Not Reported | Not Reported | 0 | 0 | Not Reported | 0 | Yes | SoulFood@Dine | No | Relationships with HBCUs (historically Black colleges and universities) continued with the Dine Brands Talent Acquisition team’s attendance at the 2023 Atlanta University Center Consortium-HBCU Career Fair, which included Clark Atlanta University, Spelman College and Morehouse College. | CEO Action for Diversity & Inclusion™ supports diversity, equity, inclusion and belonging in our company. In 2023 we piloted Executive Compensation Goals that will become individual Executive Goals in 2024. | Organized a Back to School Supply Drive, a monthlong donation event that benefited the Boys & Girls Clubs of Pasadena in their efforts to support underrepresented youth. SoulFood@Dine donated large boxes of school supplies and raised funds online. | Hosted Juneteenth events, catered by Black-owned businesses, at the Pasadena and Kansas City RSCs2 to gather in person to commemorate, educate and celebrate the liberation of Black Americans and the end of slavery. | Dine Brands Corporate Team Members -- 6% Black | https://www.dinebrands.com/-/media/dinebrands/files/2023-dine-brands-esg-report-41624.pdf | |||||||
| Domino's | Domino's | 2/15/2025 | 23.9 | 10.6 | 5.3 | 5.9 | 11.1 | No | Not Reported | Not Reported | 0 | 0 | Not Reported | 0 | Bliss (Black Leaders Innovating, Strategizing and Succeeding) | No | Mentorship at 100 Black Men of Greater Detroit: The organization 100 Black Men of America is a national nonprofit organization committed to the intellectual development of youth and the economic empowerment of the African American community. Mentoring is the cornerstone of 100 Black Men and its network of chapters, which deliver unique programs to address specific needs in their local communities. Between 2022 and 2023, Domino’s donated a total of $125,000 to five 100 Black Men chapters – Baltimore, Detroit, Houston, Las Vegas and Phoenix – to support youth mentoring. 100 Black Men of Detroit launched Detroit Project Success, a mentoring program, to increase the on time high school graduation rate in Detroit. More than 600 youth have participated in the mentoring program since its inception in 2010. In 2022 and 2023, the on-time graduation rate for mentees was 100%. “Support from great sponsors like Domino’s is the key to our success,” said Donald Ferguson, chair of the mentorship program at the 100 Black Men of Greater Detroit, Inc. “Not only does Domino’s provide the needed funding – they get involved in our programming. We are pleased that several members of the Domino’s family are also members of the 100 Black Men chapter in Detroit.” Domino’s team members supported the mentees in 2022 and 2023 by collecting school supplies and volunteering at oratorical contests. To celebrate mentees meeting their goals, Domino’s donates gift cards as a reward, and provides pizza to group events like movie night. | In 2022 and 2023, Domino’s also funded scholarships through the United Negro College Fund (UNCF) for ten students each year. | https://biz.dominos.com/content/files/2024-stewardship-report.pdf | https://biz.dominos.com/content/files/2023_EEO-1_Consolidated-Summary_r02.pdf | ||||||||||
| Electronic Arts (EA) | EA SPORTS FC™, Battlefield™, Apex Legends™, The Sims™, EA SPORTS™ Madden NFL, Need for Speed™, Titanfall™, Plants vs. Zombies™ and EA SPORTS F1® | 2/15/2025 | 4.0 | 3.4 | 200.0 | 0.0 | 12.5 | No | Yes | Not Reported | 0 | 0 | Not Reported | 0 | Yes | BEAT! African American & Black group and allies | No | We honored the legacy of John Madden with a 5-year commitment to support STEAM education among underrepresented youth. In the 2023-24 academic year, the EA Madden Scholarship Program enabled 24 students at Historically Black Colleges and Universities with financial support, mentoring, career readiness support, and a unique experience at our Orlando, Florida studio. | https://s204.q4cdn.com/701424631/files/doc_downloads/impact-report/ElectronicArts_2024ImpactReport-1.pdf | https://s204.q4cdn.com/701424631/files/doc_downloads/impact-report/ea-impact-report-23.pdf | ||||||||||
| Estee Lauder | Aerin Beauty, aramis, Aveda, Balmain Beauty, Bobbi Brown, Bumble and Bumble, Clinique, Darphin, Dr.Jart+, Editions De Partums Frederic Malle, GlamGlow, Jo Malone London, Kilian Paris, La Mer, Lab Series, Le Labo Grasse - New York, MAC, NIOD, Origins, Smahbox, The Ordinary, Tom Ford, Too Faced | 2/15/2025 | 12.6 | 6.9 | 8.1 | 7.7 | 7.1 | No | Yes | Yes | 0 | 44,000,000 | Not Reported | 3,000,000 | Yes | Network of Black Leaders and Executives (NOBLE) | No | Achieved target spend-based commitments to women-owned and Black-owned businesses in fiscal 2023. ELCCF’s support of Echoing Green helps the organization connect with and reach students at Historically Black Colleges and Universities through the Global Outreach Ambassador program. The Global Outreach Ambassador program aims to identify and cultivate bold, early stage social innovators in Echoing Green’s strategic focus demographics, one of which is emerging Black entrepreneurs. | Launched a strategic partnership with AFROTECH, one of the largest networks of Black STEM professionals, to increase our access to Black talent across all levels. | Through our partnership with Grantmakers for Girls of Color (G4GC), we are building on our existing commitments to advance both girls’ leadership and racial equity. ELCCF supports G4GC’s Black Girl Freedom Fund, part of its #1Billion4BlackGirls campaign, a 10-year initiative dedicated to supporting the brain trust, health, innovation, safety, education, artistic visions, research, and joy of Black girls, femmes, gender-expansive youth, and their families. | In fiscal 2023, with ELCCF, The Campaign committed $15 million over 5 years to establish the BCRF Health Equity Initiative to address breast cancer disparities, specifically those impacting Black women in the United States. Additionally, The Campaign funds BCRF grants that span a multitude of focus areas, from understanding basic cell biology to developing new diagnostic tests and enhancing patient quality of life during and after treatment. | In partnership with Spelman College, a global leader in STEM education for Black women, in Atlanta, Georgia, The Estée Lauder Companies Charitable Foundation (ELCCF) helped to launch the inaugural Black Beauty STEMinist Lab Intensive and Symposia to offer students a week of hands-on training and networking with women of color who hold STEM roles in the beauty and personal care industry. | https://media.elcompanies.com/files/e/estee-lauder-companies/universal/our-impact/si-s24/sis-2024.pdf?_ga=2.158985021.648947410.1739659721-507608297.1739659721 | https://media.elcompanies.com/files/e/estee-lauder-companies/universal/our-commitments/2023-si-s-report/sis-report-2023.pdf?_ga=2.78596756.1084555032.1741457690-507608297.1739659721 | https://media.elcompanies.com/files/e/estee-lauder-companies/universal/our-impact/si-s24/eeo-2023.pdf?_ga=2.177718950.2044960124.1738541415-1357142993.1711712590 | |||||
| ExxonMobil | Exxon, Mobil | 4/22/2025 | 9.9 | 7.7 | 2.8 | 0.0 | 9.1 | No | Yes | Not Reported | 1,750,000,000 | 0 | Not Reported | 0 | Black Employee Success Team | No | Black people represented 9% of hiring in 2023 | https://corporate.exxonmobil.com/-/media/global/files/sustainability/social/investing-in-people-2023.pdf | ||||||||||||
| Federal Express | FedEx | 2/15/2025 | 32.5 | 21.5 | 9.2 | 4.8 | 14.3 | No | Yes | Yes | 18,600,000,000 | 5,208,000,000 | 28.00% | 0 | Yes | Black Professionals Network | No | FedEx invests in workforce preparedness opportunities for students of all backgrounds across the country, including for students at HBCUs through a multi-year contribution of $5 million. The HBCU program includes support for the following initiatives: FedEx-HBCU Student Ambassador Program: Provides access to resources and equips students with the confidence they need to enter the professional workforce upon graduation. FedEx Express HBCU Student Co-op Program: Provides HBCU students with real-world work experience and the possibility to land an entry-level position with FedEx. FedEx Ground College Pathways Career Expos: Offers students opportunities that align with their academic pursuits and insights into real-world career experiences. This program includes virtual and in-person experiences, and to date, we have hosted four College Expos and reached nearly 120 students | FedEx supports the UNCF, and the Thurgood Marshall College Fund. | https://www.fedex.com/content/dam/fedex/us-united-states/sustainability/gcrs/FedEx_2024_ESG_Report.pdf | ||||||||||
| Ford Motor Company | Ford, Lincoln | 2/24/2025 | Yes | 24.2 | 13.3 | 3.9 | 4.0 | 6.7 | No | Yes | Yes | 0 | 0 | Not Reported | 0 | Yes | Ford African-Ancestry Network (FAAN) | No | Through our capital grants campaign in BlueOval City—Ford’s advanced electric vehicle and battery manufacturing campus in West Tennessee—we awarded $1.2 million in grants to 17 organizations in all six counties surrounding the new plants. One of our grantees is the Douglass Community Center, an active cultural gathering space cultivated by generations of Black families in the heart of southwest Haywood County, Tennessee. The Douglass community was rooted in the 1930s when 38 Black farmer families purchased plantation land previously owned by J.E. Douglass. Today, the center provides activities and services that engage and benefit the community—volunteer firefighters teach CPR, children play basketball, families gather for holiday parties and seniors enjoy luncheons and aerobics. | In partnership with 1863 ventures, we celebrated the 5th anniversary of our HERImpact pitch competition— a program that uplifts female entrepreneurs, enabling them to scale and sustain their businesses for greater impact. Since 2018, we have invested $500,000 in 27 women-led social enterprises in Detroit, Washington, D.C., Miami and Kansas City, and have helped more than 600 additional entrepreneurs increase their capacity through workshops, mentoring and access to resources. | One in four Americans are unable to access the transportation required to meet their daily needs. To help address transportation insecurity in Ford’s hometown communities, we invested $5 million in partnerships with over a dozen nonprofits working to overcome barriers in transportation-limited areas. In partnership with Feonix—Mobility Rising, we’re piloting an “Access to Care” program in Detroit that provides rides to and from medical appointments for maternal health patients, and developing a new Transportation Assistance Hub in West Tennessee that will connect individuals to existing transportation resources and establish new mobility operations to meet rural community needs in Stanton and the region. We’re helping the United Way for Southeastern Michigan expand their Ride United program in Detroit, which helps residents regain suspended driver’s licenses, make needed car repairs, acquire a vehicle, access on-demand rides and integrate with broader United Way programming and support. | https://corporate.ford.com/content/dam/corporate/us/en-us/documents/reports/2024-integrated-sustainability-and-financial-report.pdf | https://s201.q4cdn.com/693218008/files/doc_downloads/ESG/2024/07/2023-Consolidated-EEO-1-Report-for-Ford-Motor-Company_0951577_CONFIDENTIAL-1.pdf | |||||||
| Gap, Inc. | Banana Republic, Gap, Old Navy | 2/24/2025 | 15.0 | 0.0 | 10.0 | 0.0 | 9.1 | No | Yes | Not Reported | 0 | 0 | Not Reported | 30,000 | BLACK@Gap Inc. | Gap Inc. is signatories, members, or active participants of the following organizations: • 15 Percent Pledge • Black In Fashion Council | 8% of our store leaders (defined as General Managers) in the U.S. identify as Black (2025 goal: 13%) | In support of our focus on internal development and mobility of Black and Latinx talent, we invited DEI practitioners and merchants from across our brands to participate in the inaugural NRF Foundation Emerging Leaders Summit. Geared toward young professionals of color, the event allowed our teams to hear from – and gain access to – top retail industry leaders to garner exclusive insights, professional development, and support to become stronger future leaders. Further, the summit’s investment in early careerists of color helps advance the retailer community in building a more diverse and inclusive workforce. | In support of the Latinx community, Gap Inc. and Gap brand continued our annual partnership with the Lower Eastside Girls Club (LESGC) with a $60,000 donation to drive onsite programming and engagement with Black and Latinx youth. | https://gapinc-prod-a6bndyfubmc5d9ey.z03.azurefd.net/gapmedia/gapcorporatesite/media/images/values/sustainability/esg-resources/2023-gap-inc-esg-report.pdf | ||||||||||
| Geico | Geico | 2/24/2025 | 0.0 | 0.0 | 200.0 | 200.0 | 6.3 | No | Not Reported | Not Reported | 0 | 0 | Not Reported | 0 | Yes | GO BOLD (GEICO Organization for Black Outreach and Leadership Development) | Yes | GEICO partners with the National Society of Collegiate Scholars (NSCS) to provide scholarships to honor society members at over 300 colleges and universities in the United States, including the District of Columbia and Puerto Rico. Offers Changemaker Scholarships: HBCU Student of the Year Scholarship | In partnership with 100 Black Men of America, Inc., GEICO works closely with their Collegiate 100® Program. | |||||||||||
| General Mills | Annie's, Autumn's Gold, Betty Crocker, Bisquick, Blue Buffalo, Bugles, Cascadian Farm, Cheerios, Chex Cereal, Chex Mix, Cinnamon Toast Crunch, Cocoa Puffs, Cookie Crisp, Dunkaroos, EPIC, Fiber One, Gardetto's, Gold Medal, Golden Grahams, Green Giant, Haagen-Dazs, Kix, Larabar, Latina Fresh, Lucky Charms, Monster Cereals, Muir Glen, Nature Valley, Old El Paso, Oui, Pillsbury, Progresso, Raisin Nut Bran, Reese's Puffs, Total, Totino's Jeno's, Trix, Wanchai Ferry, Wheaties, Yoki, Yoplait | 2/24/2025 | 9.0 | 3.0 | 4.0 | 8.3 | 16.7 | No | Yes | Yes | 520,930,000 | 0 | Not Reported | 300,000 | Yes | Black Champions Network | No | $309,210,000 spent with minority suppliers, but no Black supplier spend reported. | Our U.S. $300,000 investment to expand the capacity of the African American Leadership Forum is supporting impact in six key areas, including education, health, public safety, economic prosperity, environmental justice and generational wealth building. | Since 2022, we have invested more than U.S. $500,000 to support Feeding America’s Equitable Food Access grants program, which combines support from multiple donors to help 40 network food banks provide nutritious food to people experiencing the highest rates of food insecurity, including individuals and households in communities of color and rural areas. In our world headquarters community of Minneapolis, Minnesota, our local grants provided support to an ecosystem of more than 30 organizations since 2020 driving equitable food access solutions for low-income households and Black, Indigenous and other people of color (BIPOC) who are disproportionately impacted by hunger and food insecurity. 84% of food security grantees in 2023 were focused on reducing racial disparities in household food security, as Black, Indigenous and other communities of color disproportionately experience hunger and food insecurity $13.2+ million in charitable giving since June 2020 to nonprofits centered on promoting equitable food access. Supporting BIPOC Food Entrepreneurs: General Mills supports the Northside Economic Opportunities Network (NEON) and its work to strengthen local food entrepreneurship through expansion of its food business incubator. By building and supporting a diverse, multicultural cohort and community of food entrepreneurs, NEON seeks to bring community vibrancy, locally grown development and wealth to North Minneapolis. | General Mills was a founding member of the Minnesota Business Coalition for Racial Equity (MBCRE) to create sustainable and meaningful change around racial and social justice for Black Minnesotans. As part of our ongoing support to MBCRE, a General Mills employee serves as the organization’s full-time managing director. MBCRE includes more than 30 organizations and has achieved the following impact: Successfully lobbied for the passage of the CROWN Act to ban race-based hair discrimination for all Minnesotans, making Minnesota the 20th state in the United States to pass the legislation and support inclusive workplaces and schools. Worked with Boston-based The Partnership, Inc., to create Minnesota’s first regional leadership development program for Black mid-level managers, the Minnesota Black Fellows Cohort. For ten months, 17 high-potential, mid-career professionals receive 1:1 executive coaching, participate in monthly development sessions in an effort to accelerate the next generation of Black corporate leaders and increase Black representation at senior levels in Minnesota-based companies. Launched a Deposit Challenge to support First Independence Bank, Minnesota’s first Minority Deposit Institution, expand access to capital and help close the homeownership gap for Black Minnesotans. More than 50 accounts have been opened with more than U.S. $3 million deposited from member organizations like GREATER MSP, Greater Twin Cities United Way and others. Learn more. Partnered with TurnSignl, which can connect a motorist to an attorney in the midst of a traffic stop, to increase access to the app across MBCRE member companies. Our partnership continues the business community’s commitment to shift models of public safety and emphasizes the importance of investing in employee well-being. Partnered with the Minnesota Black Collective Foundation, Minnesota’s first Black community foundation, to build, sustain and endow the institution for the next decade. The initial U.S. $2.5 million raised aims to shift philanthropic power and advance Black-led change. | 82% of grantees funded by General Mills in 2023 were focused primarily on improving the lives of Black, Indigenous and/or people of color and reflect that commitment in their mission, goals, programming and actions. $10 million in charitable giving since June 2020 to nonprofits and key initiatives aimed at promoting equitable food access and equity in education (U.S. dollars).** 53% of all grantees funded in 2023 were led by Black, Indigenous and/or people of color. | https://globalresponsibility.generalmills.com/images/General_Mills-Global_Responsibility_2024.pdf | |||||||
| General Motors | Chevrolet, Buick, GMC, Cadillac | 2/15/2025 | 19.8 | 0.0 | 6.4 | 0.0 | 16.7 | No | Yes | Yes | 5,600,000,000 | 1,176,000,000 | 21.00% | 0 | Yes | 2023: General Motors was ordered by a federal appeals court to defend against claims by a Black safety supervisor, who said she endured years of racism and sexism at an upstate New York plant where other workers displayed Confederate flags and nooses. | In the United States, we are working to drive generational change through our Inclusion Fund. We aim to support historically underserved communities by supporting organizations that drive meaningful change in the areas of education, economic empowerment and health. These grants are intended to support outcomes that include access to quality early childhood education (with an emphasis on science, technology, engineering and mathematics (STEM)), providing resources for entrepreneurs and improving access to mental health services so that communities have higher standards of living. In 2023, GM’s Inclusion Fund disbursed more than $7 million to 62 nonprofit organizations. | https://www.gm.com/content/dam/company/docs/us/en/gmcom/company/GM_2023_SR.pdf | ||||||||||||
| Goldman Sachs | Goldman Sachs | 2/15/2025 | 8.5 | 3.6 | 3.8 | 12.5 | 7.7 | No | Yes | Yes | 485,000,000 | 0 | Not Reported | 1,005,000,000 | Yes | Black Network | Yes | One Million Black Women: 10 years. $10 billion in investment capital. $100 million in philanthropic capital. | Initiated in 2020, Market Madness: HBCU Possibilities Program continues to be a cornerstone of the firm’s five-year, $25 million commitment to Historically Black Colleges and Universities, deepening our investment across the HBCU community and helping us reach our aspirational goal of doubling campus analyst hiring from HBCUs in 2025. • The program annually provides 150 students from 12 HBCUs with a semester-long, immersive introduction to finance fundamentals. • Students have the opportunity to participate in a final case study competition to win up to $1 million in scholarship funding for their school. Students who complete the program also receive an academic stipend. • 100+ Goldman Sachs professionals support students throughout the experience as mentors and coaches. | Black and Hispanic/Latinx Analyst and Associate Initiative: Provides Black (Americas and EMEA) and Hispanic/Latinx (Americas) analysts and associates access to coaching support through our trained and more senior leaders. | Vice President Sponsorship Initiative: This program provides a sponsorship model for women, Black, Hispanic/Latinx, Asian, and LGBTQ+ vice presidents. | Via a public/private partnership, New York City and Goldman Sachs will be offering a new $50 million line of credit to Minority Business Enterprise (MBE) developers. | https://www.goldmansachs.com/our-commitments/sustainability/2023-people-strategy-report/multimedia/report.pdf | |||||||
| Android, Chrome | 2/25/2025 | 4.7 | 4.2 | 5.2 | 0.0 | 20.0 | No | Yes | Yes | 2,000,000,000 | 0 | Not Reported | 5,000,000 | Yes | Black Googler Network (BGN) | No | In the U.S., Google.org provided Spelman College with $5 million in grant funding and a team of 18 Google.org Fellows and volunteers to help build a digital platform dedicated to spotlighting the achievements of Black women in STEM. Google.org Fellows added 21,000 relevant new data points to Data Commons, spanning from 2003 to 2021. Researchers and policymakers can now combine this new data with the other three billion+ data points in Data Commons to derive new insights. | In the U.S., we collected and transcribed a test dataset of African American Vernacular English (AAVE) in partnership with Howard University and other Historically Black Colleges and Universities (HBCUs) to reduce racial disparities in speech recognition. | https://static.googleusercontent.com/media/about.google/en//belonging/diversity-annual-report/2024/static/pdfs/google_2024_diversity_annual_report.pdf | |||||||||||
| Hasbro | Baby Alive, Hasbro Gaming, Monopoly, PJMasks, Scrabble, BeyBlade, Hydro Pods, My Little Pony, Play-Doh, Star Wars, Furby, Marvel, Nerf, Potato Head, Transformers, G.I. Joe, Mixmashers, Peppa Pig, Power Rangers | 2/24/2025 | 2.8 | 1.9 | 3.4 | 10.0 | 18.2 | No | Not Reported | Not Reported | 0 | 0 | Not Reported | 0 | Not Reported | Not Reported | No | https://assets-us-01.kc-usercontent.com/500e0a65-283d-00ef-33b2-7f1f20488fe2/dfe884c5-fe69-420a-aba4-21d7921e8fd4/Hasbro%202023%20ESG%20Report%20-%20Final%20%281%29.pdf | https://assets-us-01.kc-usercontent.com/500e0a65-283d-00ef-33b2-7f1f20488fe2/dfea8031-f6d3-4d51-9ce5-08ba0cae8439/2023%20EEO-1%20Shortened%20for%20Website.pdf | |||||||||||
| Hilton | DoubleTree, Hilton Garden Inn, Hampton, Waldorf Astoria, LXR Hotels & Resorts, Conrad Hotels & Resorts, Signia, NoMad, Canopy, Graduate, Tempo, Motto, Curio Collection, Tapestry Collection, Embassy Suites, Homewood Suites, Home2 Suites, LivSmart Studios, Tru, Spark, Autocamp | 2/5/2025 | 19.8 | 12.5 | 3.7 | 0.0 | 11.1 | No | Yes | Yes | 467,000,000 | 0 | Not Reported | 0 | Not Reported | Yes | https://esg.hilton.com/wp-content/uploads/sites/4/2024/07/2023-Travel-with-Purpose-Report-final.pdf | https://cdn.phenompeople.com/CareerConnectResources/HILTGLOBAL/documents/2023EEO-1Report-1734967873843.pdf | ||||||||||||
| Home Depot | Home Depot | 2/5/2025 | 18.4 | 15.3 | 6.6 | 18.2 | 9.1 | No | Yes | Yes | 3,200,000,000 | 0 | Not Reported | 3,160,000 | Yes | Yes | Retool Your School: The Home Depot quadrupled its investment in 2023 by doubling its flagship campus improvement grants and by investing to support new grants focused on community projects and career resources for students in its Retool Your School program. As a part of the increased investment, our commitment will help prepare HBCU students to thrive in their future careers with new needs-based programs, including career workshops and innovation lounges that aim to help students explore entrepreneurship and career paths and to invest in their communities. 30+ schools received 10,000-150,000 each | https://corporate.homedepot.com/sites/default/files/2024-08/2024_ESG_Report_The_Home_Depot.pdf | https://ir.homedepot.com/~/media/Files/H/HomeDepot-IR/2024/2023%20THD%20EEO-1%20Report_v2.pdf | |||||||||||
| Honda Motor Company | Honda, Acura | 2/5/2025 | 15.0 | 0.0 | 6.4 | 0.0 | 0.0 | No | Yes | Not Reported | 2,970,000,000 | 0 | Not Reported | 700,000 | Yes | Yes | Thousands of fans, students and alumni converged upon Alabama State University (ASU) on Saturday, Feb. 18, 2023 to take part in the 18th Honda Battle of the Bands Invitational Showcase (HBOB), the nation’s premiere showcase for Historically Black Colleges and Universities (HBCUs) marching bands and dance teams. Marking its return to a live event format for the first time since 2020, HBOB also was held for the first time on an HBCU campus, featuring spectacular performances from six marching bands representing HBCUs. The six HBCU marching bands that performed in the 2023 HBOB Invitational Showcase included both first-time and veteran HBOB bands: • Alabama State University, Mighty Marching Hornets – 7th appearance • Langston University, Marching Pride – 4th appearance • Morgan State University, Magnificent Marching Machine – 1st appearance • Savannah State University, Powerhouse of the South – 7th appearance • Texas Southern University, Ocean of Soul – 3rd appearance • Virginia State University, Trojan Explosion – 10th appearance Building on Honda’s longstanding support for HBCUs, each of the six participating universities also received a $50,000 grant from Honda to support their music education and career development programs. Honda also supported nonprofit organizations within the host city of Montgomery through $120,000 in grants to local nonprofit organizations. | 1.1%: Black Ownership of Honda and Acura Dealers in 2023 8.4%: Black Honda and Acura sales in 2023 | Honda partners with the National Urban League, and one of the NUL’s flagship programs is the Business Executive Exchange Program (BEEP). BEEP engages students in career exploration and planning through several different formats, ranging from two-day seminars to semesterlong virtual programs. Through BEEP, Honda can connect directly with students and share internship and job recruitment opportunities. The Drive the Legacy Initiative has helped increase BEEP’s presence, brand recognition and recruitment engagements on HBCUs across the country. | Honda Campus All-Star Challenge (HCASC), America’s premier academic competition for students from Historically Black Colleges and Universities (HBCUs), is a year-round program that celebrates Black excellence and challenges students to expand their scope of knowledge on a wide range of topics, with the opportunity to gain lifelong learning skills, including leadership, collaboration and sportsmanship. Hosted on the American Honda corporate campus in Torrance, California, more than 200 HBCU students, along with their coaches, participated in the 34th HCASC National Championship Tournament in April 2023. Stillman College earned top honors and a $75,000 institutional grant from Honda, runner-up Tuskegee University was awarded a $30,000 grant, while the third and fourth place finishers – Winston-Salem State University and Oakwood University, respectively – each received a $20,000 grant. University of the District of Columbia, Southern University and A&M College, Spelman College and Tennessee State University rounded out the “Great 8” teams that competed in the HCASC Finals. Beyond the competition, the HCASC program included student networking opportunities and activities with HBCU presidents and representatives. Honda provided more than $400,000 in institutional grants to the participating HBCUs. | Honda hosted 30 students at its Ohio manufacturing and R&D operations for an immersion event in partnership with the Thurgood Marshall College Fund. For four days, HBCU students were immersed into Honda operations and culture. Students toured the Marysville Auto Plant (MAP) and the North American Auto Development Center and participated in several activities that showcased the wide breadth of career opportunities available at Honda. At the end of the event, students had the opportunity to interview for co-op positions through Honda’s Talent Acquisition program. | https://global.honda/en/sustainability/cq_img/report/pdf/2024/honda-SR-2024-en-all.pdf | https://csr.honda.com/content/uploads/2024/04/Honda_Diversity_Report.pdf | |||||||
| HP | Omen, HyperX, Z by HP, HP Wolf Security, HP Anywhere, Fitstation by HP | 2/10/2025 | 5.9 | 3.2 | 5.1 | 9.1 | 14.3 | No | Yes | Yes | 695,000,000 | 33,000,000 | 4.75% | 0 | Yes | Yes | No | We partner with historically Black colleges and universities (HBCUs) to increase the representation of Black/African American engineers in the high-tech workforce. In 2023, HP sponsored and participated in the White House HBCU Conference, highlighting our education and workforce priorities. In 2023, we continued our HBCU Partnership Program, which includes an on-campus engagement plan with Prairie View A&M University, Texas Southern University, North Carolina A&T State University, Morgan State University, St. Philip’s College, Tuskegee University, Morehouse College, Spelman College, Clark Atlanta University, and Denmark Technical College. Our partnership includes the annual HP HBCU Business Challenge, which tasks students with tackling critical business problems while gaining valuable industry experience. In 2023, HP partnered with a university to pilot the challenge as part of the curriculum for one of its senior-level marketing classes. Students worked on identifying viable solutions that leverage AI to build products and services for the future of work. In September 2023, HP also hosted the third annual HBCU Technology Conference, where academics and industry leaders shared impactful presentations on digital transformation, the future of work, cybersecurity, sustainability, and diversity in the tech sector. We expanded the conference to include a one-day immersive HP Campus Day experience. See Education. | We advocate for equitable treatment of Black/African American people through public policy, civic action, and clear corporate positions on local and national issues. We continue to work to protect and expand the rights of diverse communities through legislative lobbying and civic engagement at the U.S. federal and state levels. We are also supporting skills-first hiring legislation, alongside job-readiness educational initiatives that promote career pathways for Black/African American people—advocacy that is aligned with HP’s Skills First hiring initiative. | legal has set a goal of ensuring at least 15% of overall outside counsel spend goes to Black/ African American–led law firms. And In 2023, we engaged Black/African American and women-owned firms to execute more than 10% of our commercial paper issuance. | https://www8.hp.com/h20195/v2/GetPDF.aspx/c08980815.pdf | https://h20195.www2.hp.com/v2/getpdf.aspx/c08132290.pdf | ||||||||
| Hyatt | Alila, Alua, Andaz, Atona, Breathless, Caption, Destination, Dreams, Grand Hyatt, Hyatt Centric, Hyatt House, Hyatt Place, Regency, Hyatt Studios, Impression by Secrets, JDV, Me and All Hotels, Miraval, Park Hyatt, Secrets, Sunscape, Thompson Hotels, The Unbound Collection, Hyatt Vivid, Z Hyatt Zilara and Ziva, Zoetry Wellness & Spa Resorts, UrCove | 2/25/2025 | 14.8 | 13.1 | 6.4 | 9.1 | 16.7 | No | Yes | 0 | 0 | Not Reported | 3,000,000 | Yes | Hyatt B.L.A.C.K. | No | As part of the Change Starts Here Grant Program, the Hyatt Hotels Foundation committed to providing $1M USD to six community-based organizations between 2022-2024. Throughout 2023, the grant recipients located in Chicago, Atlanta and Minneapolis used funds to further various vocational, business and community development needs in three areas — RiseHY: reaching Opportunity Youth, small and minority-owned businesses and strengthening Chicago communities. Recipients: - The Male Mogul Initiative provides leadership and professional development training to young men in Chicago. - The Black Man Lab Foundation conducts workshops focused on business and entrepreneurship for young Black men in Atlanta. - Allies for Community Business covers business growth for small, diverseowned businesses in Chicago. - Neighborhood Development Center connects Black and Latina women entrepreneurs in Minneapolis with mentorship from other local business owners. - Urban Juncture Foundation provides spaces that local enterprises can use for training, networking and coaching needs. - Greater West Town Community Development Project provides participants with basic adult education and skills-based training. | GOAL: Who We Buy From and Work With: Achieve 10% of Black supplier spend as a percentage of all diverseand women-owned supplier spend by 2025 (U.S. only). PROGRESS: Surpassed 2025 Black supplier spend goal. As of year-end 2023, Black supplier spend accounted for 50% of all Avendra* diverse- and women-owned supplier spend (U.S. only). *Hyatt is a contracted customer of Avendra, a leading GPO (group procurement organization) in North America. Avendra assists Hyatt in achieving our DE&I goals. | Hyatt Regency Dallas (Texas) hosted its secondannual showcase to connect 70 Black- and diverse-owned food and beverage businesses with potential customers. | The Hyatt Hotels Foundation was an early supporter of the Harriet Baskerville Incubation Program (HBIP), a Black-owned nonprofit in San Antonio, Texas, with a mission to increase representation in the commercial brewing industry by providing women and people of color with necessary education, training and mentorship to support their pathway to brewing careers and brewery ownership. | Hyatt annually sponsors HBCU students to attend three conferences hosted by the National Society of Minorities in Hospitality (NSHM). In 2023, related funds covered travel and accommodations for 150 students – a critical step for those who may not have had the means or access without sponsorship. In the 2022-2023 academic year, Hyatt added four HBCUs – Delaware State University, Morgan State University, North Carolina Central University and Virginia State University – to its existing list of recruited schools to support diverse students discovering potential careers in hospitality. | https://about.hyatt.com/content/dam/hyatt/woc/2023DEIReport.pdf | https://about.hyatt.com/content/dam/hyatt/woc/Hyatt_Hotels_Corporation_2023_EE0-1_Report.pdf | |||||||
| Hyundai Motor Group | Hyundai Motor Company, Kia, Genesis | 2/25/2025 | 0.0 | 0.0 | 200.0 | 9.5 | 0.0 | No | Not Reported | Not Reported | 0 | 0 | Not Reported | 40,000 | Yes | Hyundai Soul | No | Hyundai has contributed $25,000 to support the Howard University's HBCU-Africa Correspondents Corps (HBCU ACC) program, an initiative of the Center for African Studies. This initiative is designed to bridge the diversity gap in international affairs by providing African and African Diaspora students with valuable professional development opportunities. | The Progress Project at Hyundai provided financial support to Black-owned business so they can foster growth in their community. This year, award recipients were chosen in Ann Arbor and Ypsilanti, Michigan—near Hyundai America Technical Center, Inc. and the new Safety Test and Investigation Laboratory in Superior Township to receive donations of $15,000. The Black-owned businesses to receive donations included 3N1 Fitness Revolution, a multidimensional gym of holistic well-being where members can get physically, nutritionally, and mindfully fit; A-Square Fight Club, an affordable boxing gym that focuses on the art, conditioning, and science behind training; and Issa’s Pizza, a cherished establishment catering uniquely to Michigan’s diverse community. | Hyundai and Pandora hosted an exclusive event in New York, dedicated to celebrating the arts through an immersive and intimate experience. The event featured a stimulating discussion on the evolution and diversification of artistic mediums, alongside heartfelt tributes to cultural contributors. This unique experience highlighted the invaluable contributions of Black thought leaders in music, visual arts, fashion, dance, and beyond, offering our consumers an enriching perspective. Additionally, a donation was provided to the Black Music Action Coalition to uplift and empower Black artists, organizations, and individuals. | Florida A&M University and the Black Automotive Media Group Renew Internship Program with Hyundai Motor America - 10-week internship offers HBCU students hands-on experience in the automobile industry - The Driving Force initiative expands opportunities for underrepresented talent in automotive media | https://www.hyundai.com/content/hyundai/ww/data/csr/data/0000000052/attach/english/hmc-2024-sustainability-report-en-v4.pdf | ||||||||
| IHG | Six Senses, Regent, Intercontinental, Vignette, Kimpton, Hotel Indigo, Voco, Hualuxe, Crowne Plaza, Iberostar, Even, Holiday Inn Express, Holiday Inn, Garner, Avid, Atwell Suites, Staybridge Suites, Holiday Inn Club Vacations, Candlewood Suites | 2/25/2025 | 0.0 | 0.0 | 200.0 | 0.0 | 0.0 | No | Yes | Not Reported | 0 | 0 | Not Reported | 0 | Yes | BERG | No | In 2023, our activities included welcoming 34 interns on a Corporate Summer Internship Programme at our corporate office in Atlanta (a 30% increase on last year), running HBCU Days at our Atlanta office to give students a taste of working for IHG, hosting talks and networking events for marketing students from Clark Atlanta University, hosting a careers day at Kennesaw State University, and refreshing our early careers website. | 2023: IHG will commit more than $30 million of support over the next five years, with the aim of unlocking common barriers to hotel ownership among these groups and empowering diverse owner-entrepreneurs for success. Our support for under-represented groups has also involved sponsoring conferences, speaking engagements and providing expertise for organisations such as the National Association of Black Hotel Owners, Operators and Developers (NABHOOD) and the Latino Hotel Association. | In support of our commitment to drive respect for and advance human rights, we have announced renewed partnerships with leading organisations PACT (formerly ECPAT-USA) and Polaris, which strengthen our ongoing eorts to prevent human traªicking. | We continue to work with food recovery and distribution company Goodr, whose app and logistics network make it quick and simple to pick up excess and expiring food from our hotels and donate it to local non-profit organisations. Our joint efforts have more than tripled our impact since 2022, with over 19,000 meals donated, equivalent to 23,000 lbs of food diverted from landfills across participating hotels in 2023, which has also saved hotels an estimated $77,000 in tax as a result of the donations. | https://www.ihgplc.com/~/media/Files/I/Ihg-Plc/investors/annual-report/2023/ihg-responsible-business-report-2023.pdf | https://www.ihgplc.com/~/media/Files/I/Ihg-Plc/responsible-business/reporting/2024/2023%20Progress%20Report.pdf | |||||||
| Inspire Brands | Arby's, Baskin Robbins, Buffalo Wild Wings, Dunkin Donuts, Jimmy Johns, Sonic | 2/25/2025 | 0.0 | 0.0 | 200.0 | 0.0 | 200.0 | No | Not Reported | Not Reported | 0 | 0 | Not Reported | 0 | Not Reported | Black Voices @ Inspire | No | No ESG/Social Impact reporting since 2022. | 2022: Dunkin’ and Baskin-Robbins have worked with the National Association for the Advancement of Colored People or the NAACP® since 2013 when they entered a partnership to increase awareness of franchising opportunities at Dunkin’ and Baskin-Robbins restaurants. The partnership among NAACP, Dunkin’, and Baskin-Robbins focuses on franchise education and increasing awareness of franchising opportunities and supports an internship program to empower NAACP Youth. In 2021, Dunkin’ and Baskin-Robbins committed funding to seed NAACP’s Inclusive Economy Program work. This program provides aid and resources to black business owners. | 2022: Black Voices at Inspire Provides development opportunities, peer and mentoring education initiatives, and encouragement for recruitment and advancement of qualified black professionals within Inspire. | ||||||||||
| Intel | Intel | 2/25/2025 | 4.9 | 4.2 | 2.6 | 15.4 | 7.7 | No | Yes | Yes | 1,600,000,000 | 0 | Not Reported | 2,000,000 | Yes | Network of Intel African Ancestry | Yes | No | Since 2008, we have linked a portion of our executive and employee compensation to corporate responsibility metrics, including those related to diversity and inclusion. The 2023 inclusion goals included women representing 30% of technical, salaried early career8 hires; increasing by another 10% the representation of Black/African American employees in senior, director, and executive-level roles in our US workforce (to 3.69%); and advancing toward our goal of $2 billion in annual spending with diverse suppliers. We exceeded our 30% hiring goal for women in technical global, salaried early career roles, closing the year at an over 31% hiring rate. We fell short of our goal to reach 3.69% representation of Black/African American senior, director, and executive-level representation, ending the year with 3.21% representation. Lastly, we spent $1.6 billion with diverse-owned suppliers, meeting our annual goal of $1.6 billion following a record year in 2022, when we first exceeded our 2030 $2 billion ambition. For more information, see our 2024 Proxy Statement, “Supplier Diversity and Inclusion” later in this section, and the Sustainable section of this report. | In 2023, we continued to deliver Talent Keepers, a program aimed at engaging mid-level Black and African American employees in the US and Costa Rica more directly with their managers in career development and progression discussions and initiatives. A total of 436 employees and 263 managers have completed the program since launch, with employee participants showing better promotion (+1.3%) and retention (+4%) rates than their counterparts. | In August 2020, Intel Capital announced a commitment to double its investments in Black founders over the next five years. At the end of 2022, approximately 6% of our venture dollars committed were in companies led by Black founders. | We invested over $5 million over the past five years in historically Black colleges and universities (HBCUs) to support student research and retention programs in preparation for semiconductor careers. We have collaborated with top HBCU engineering and computer science programs at Florida A&M, North Carolina A&T, Morgan State, Tuskegee, Prairie View A&M, and Howard to create advanced research opportunities for students and faculty in AI, the Internet of Things, and hardware/ software development. Since 1981, Intel has collaborated with the National GEM Consortium to advance the next generation of STEM professionals. In the last five years, Intel has given nearly $4 million to support the GEM Fellowship Program, which aims to increase participation of underrepresented groups in graduate STEM degrees. Going forward, we look to expand our student engagement through hackathons, summer design externships, mentor programs, and other activities connecting students with our employees. Also, as announced in February 2021, Intel pledged to North Carolina Central University (NCCU), a $5 million grant over five years to help the school create a first-of-its-kind tech law and policy center. This engagement makes NCCU the only HBCU and only law school in the country with a Tech Law Center that focuses on technology disparities and social justice. As NCCU is one of only six HBCUs with a school of law, it is uniquely positioned to carry forward the important work of developing solutions that address tech equity, while creating a more diverse workforce in the legal profession. In 2023, Intel commemorated the inaugural NCCU School of Law Tech Law and Policy certificate graduates. We hosted two students for the summer associate program and participated in NCCU’s Law & Technology Summit as keynote speaker and in AI-related workshops. Additionally, we paired more than 25 NCCU law students with Intel mentors. The program is designed to help grow the pipeline of Black attorneys in tech and corporate practices. Second- and third-year law students who have identified an interest in technology-related legal careers are matched with practicing Intel attorneys or policy professionals for an academic year-long mentoring engagement. | Intel’s Client Computing Group (CCG) is working to create scalable, sustainable collaborator-enabled community technology programs in alignment with our business and social impact priorities and those of our customers and other stakeholders. This work started in 2022, when CCG provided tech expertise and resources to help accelerate more than 15 HBCU student start-ups; collaborated with Lenovo to provide 220 refurbished systems and peripherals to 20 schools and community organizations; and provided hardware and AI training to the Hidden Genius project, which trains and mentors Black male youth in technology creation, entrepreneurship, and leadership. Building on this momentum in 2023, we collaborated with ASUS to launch an employee-led STEM program that simultaneously yielded product design improvements; supported sustainability activities with the Aeras Foundation, which focuses on equitable access to technology; helped the Portland Trailblazers with outreach at a Boys & Girls Club and the Cleveland Cavaliers with outreach to schools in Ohio; and formed an engagement to accelerate AI entrepreneurship in Africa. In Oregon, Intel also worked with East Metro STEAM and the Multnomah Education School District to create a K-12 Esports league serving 27,000 students with Intel hardware, technical expertise, and volunteers. These ongoing and diverse community engagements underscore Intel’s dedication to both business objectives and social impact, emphasizing the transformative role of technology. | https://csrreportbuilder.intel.com/pdfbuilder/pdfs/CSR-2023-24-Full-Report.pdf | https://www.intel.com/content/dam/www/central-libraries/us/en/documents/2024-05/2021-2023-eeo-1-pay-disclosure-report.pdf | |||||
| JetBlue | JetBlue | 2/25/2025 | 0.0 | 0.0 | 200.0 | 0.0 | 15.4 | No | Yes | Not Reported | 0 | 0 | Not Reported | 0 | JADE (JetBlue African Diaspora Experience) | No | No Social Impact Report since 2022. | |||||||||||||
| JPMorgan Chase | JPMorgan, Chase | 2/25/2025 | 14.0 | 9.0 | 5.0 | 0.0 | 18.2 | No | Yes | Yes | 2,300,000,000 | 0 | Not Reported | 100,000,000 | Yes | BOLD | Yes | Lending and Banking Services: As a Small Business Administration preferred lender, our Firm is proud to serve small businesses. In 2023, our Firm’s Business Banking division provided $4.8 billion in loans and lines of credit to small businesses in the U.S., including $1.1 billion to small businesses in majority Black, Hispanic and Latino communities as part of our Racial Equity Commitment. The Business Card Special Purpose Credit Program (“SPCP”), launched in January 2023, has provided over 10,900 cards, totaling over $43 million in available credit lines to underserved entrepreneurs and communities across the U.S. | Entrepreneurs of Color Fund: We provide fnancing to the Entrepreneurs of Color Fund (“EOCF”), a program to support local Community Development Financial Institutions (“CDFIs”). EOCF works with 33 CDFIs in 10 markets across the U.S. to increase access to capital for entrepreneurs of color and all other entrepreneurs serving communities of color. In 2023, CDFIs participating in the EOCF reported that over 2,900 loans totaling approximately $176 million were supported through the program. | In 2023, we extended more than $5 billion in lending for affordable rental housing, helping to create and preserve more than 41,000 afordable rental housing units. This includes our Firm’s Community Development Banking business and operation of our Commercial Term Lending Afordable Housing Preservation Program. We have expanded our $5,000 Chase Homebuyer Grant, a component of our SPCP, to more than 15,000 majority Black, Hispanic and Latino communities, more than doubling the geographic coverage since the program’s launch in 2021. | Since 2020, we have invested more than $100 million of equity in Black, Hispanic and Latino-owned and -led MDIs and CDFIs, having an impact on more than 90 communities across 21 states and the District of Columbia. We have onboarded each institution as a client and continue to provide access to our expertise, resources and network, creating opportunities for business expansion, community engagement and mentorship. In 2023, our Firm extended more than $240 million in lending and committed $24 million in philanthropic capital to CDFIs and community development intermediaries. | As of December 31, 2023, we reported $30.7 billion of progress toward our fve-year Racial Equity Commitment. The Racial Equity Commitment’s 2023 progress continued to be driven by our afordable housing commitments, where our Firm has invested and fnanced billions of dollars to help preserve and create afordable rental housing. | https://www.jpmorganchase.com/content/dam/jpmc/jpmorgan-chase-and-co/documents/jpmc-esg-report-2023.pdf | https://www.jpmorganchase.com/content/dam/jpmc/jpmorgan-chase-and-co/documents/2023-workforce-composition-disclosure.pdf | ||||||
| Kenvue | Tylenol, Listerine, Meutrogena, Band-Aid, Motrin, Aveeno, Zarbees, Johnson's, Zyrtec, Rhinocort, Benadryl, OGX, Nicorette, Dr. Ci Labo, Orsl | 2/25/2025 | 8.9 | 8.3 | 9.2 | 0.0 | 18.2 | No | Not Reported | Not Reported | 0 | 0 | Not Reported | 0 | Not Reported | Black at Kenvue | No | In 2023, the Aveeno® SkinVisibility program brought together a roster of dermatologists, skin health advocates, and celebrities to drive conversation around eczema’s disproportionate impact on the Black community. The program also helped 200,000 Black women and women of color have access to culturally sensitive healthcare providers and receive resources on treating eczema prone skin. In 2023, the program has achieved 300+ million media impressions, 1.2 million social media impressions and the Eczema Equality video has reached more than 1.1 million viewers. | More than 12% of the U.S. population identifies as Black, however studies show that fewer than 4% of dentists 30 identify as such. At the same time, there is a major disparity in oral health care access, with a reported 40% of Black adults in the U.S. living with untreated dental cavities.31 By improving Black representation and increasing the percentage of practicing Black dentists, we can positively impact the understanding, behaviors, and access around oral healthcare. To do so, Listerine® has partnered with cultural agency Compound to introduce The Whoa Collection, a collaboration designed to spark conversation and, most importantly, drive awareness and help close the diversity gap in dentistry within the Black community. The partners worked with prominent Black artists and engaged impactful culture curators to develop a limited-edition bottle design, an original musical track, digital and social content, and endowment. | https://www.kenvue.com/hlm-report-2023 | https://www.kenvue.com/eeo-1-report-2023 | |||||||||
| Keurig Dr. Pepper | Dr. Pepper, 7Up, Crush, Sun Drop, Canada Dry, Sunkist, Squirt, Clamato, Schweppes, Hawaiian Punch, ReaLemon, Snapple, Core Hydration, YooHoo, RC Cola, A&W Root Beer, bai, Big Red, Vernors, Venom Energy,, Stewart's Fountain Classics, Nantucket Nectars, Mr & Mrs T, IBC Root Beer, Cactus Cooler, Margaritaville Margarita Mix, Rose's, Xyience, Mistic, Penafiel | 2/25/2025 | 19.4 | 8.3 | 2.6 | 0.0 | 18.2 | No | Yes | Yes | 212,000,000 | 0 | Not Reported | 0 | African American & Allies | No | Downloaded | https://keurigdrpepper.com/2023-Employer-Information-Report-EEO-1-Component-1.pdf | ||||||||||||
| Kia Motors (America) | Kia | 2/25/2025 | 0.0 | 0.0 | 200.0 | 0.0 | 0.0 | No | Not Reported | Not Reported | 0 | 0 | Not Reported | 0 | No | https://worldwide.kia.com/int/files/company/sr/sustainability-report/sustainability-report-2024-int.pdf | ||||||||||||||
| Kohl's | Kohl's | 2/25/2025 | 15.5 | 7.1 | 3.5 | 10.0 | 16.7 | No | Yes | Not Reported | 0 | 0 | Not Reported | 0 | BLACK PROFESSIONALS BRG | No | Kohl’s funding will strengthen the organization’s mission of ensuring everyone in the Milwaukee community has access to nutritious food. The grant, which is a continuation of Kohl’s and Hunger Task Force’s 15-year partnership, will address current food donation shortages and help ensure an average of 31,000 individuals a month have access to free, healthy food options. Support will be directed to Hunger Task Force’s network of 68 food pantries, homeless shelters, senior dining sites, and soup kitchens, and providing children free meals this summer through the Milwaukee Summer Meals program. | COA YOUTH & FAMILY CENTERS Kohl’s support expands Kohl’s Explore Your Future events for teens and provides daily programs for youth so they have a safe environment during hours when school is not in session. Additional opportunities are also being funded for youth and teens to engage in STEM programming and gain a greater understanding of STEM opportunities and college/career paths. | https://s204.q4cdn.com/271435555/files/doc_downloads/esg/2024/08/kohl-s-cares-2023-report-final.pdf | https://s204.q4cdn.com/271435555/files/doc_downloads/esg/2024/2023-kohl-s-eeo1.pdf | ||||||||||
| Kraft Heinz | Oscar Meyer, Ore-Ida, Velveeta, Smart Ones, Capri Sun, Kool-Aid, Jell-O, Philadelphia Cream Cheese, Golden Circle, Lunchables, Maxwell House, Grey Poupon, Honig | 2/5/2025 | 20.3 | 7.1 | 2.6 | 0.0 | 20.0 | No | Yes | Not Reported | 0 | 0 | Not Reported | 0 | Not Reported | Black BRG | No | Heinz faced backlash for an advertising campaign over accusations of perpetuating racist stereotypes (blackface) | The Heinz Black Kitchen Initiative, a partnership with the Lee Initiative and Southern Restaurants for Racial Justice (SRRJ )began in 2020 with the ambition to celebrate, uplift, and preserve the legacy of Black food by breaking down the barriers that keep Black voices and cooking out of the American culinary pantheon. In 2023, Heinz continued to sponsor this hallmark grant program, resulting in 62 additional Black food businesses across the US receiving grants from the Black Kitchen Initiative and bringing the brands total grant contribution so far to $3 million to further celebrate these voices, the award-winning Black Kitchen series podcast spotlight black culinary innovators and the many ways black individuals are moving the culinary space forward. In 2023 we created Open Kitchen a new event series that gives up and coming Black chefs a chance to grow their clientele and gain exposure for their culinary businesses kicking off in partnership with world, renowned chef Marcus Samuelson, passing current Black Kitchen Initiative grants will take over high profile restaurant, kitchens and exclusive pop-up experiences. | We celebrated our fourth annual Kraft Heinz Day of Service on June 19, 2023, to honor and commemorate Juneteenth by encouraging our U.S. and Canada employees to mobilize their time, talent, and treasure for change. Employees heard from James Beard Award-Winning chef Eric Williams of Chicago’s Virtue Restaurant & Bar. He shared his career journey, the role of food in Black culture and community, and how allies have influenced his journey. The Heinz Black Kitchen Initiative (BKI) team brought to life “The Black Kitchen Series” podcast by inviting host Jade Verette to moderate a Fireside Chat with Chef Amethyst Ganaway and Galveston Historical Foundation’s Chair of African American Heritage, Tommie Boudreaux. Through partnerships with Generus, Goodr, and WeLoveU organizations, employees supported families and individuals across Chicago, Pittsburgh, and Toronto by volunteering to pack groceries, build STEM Education Kits, and clean up local parks. The Annual North America Zone Steps Challenge and United Negro College Fund (UNCF) Donation drive brought together business units in support of “Higher Education for All.” | https://www.kraftheinzcompany.com/esg/pdf/KraftHeinz-2024-ESG-Report.pdf | https://www.kraftheinzcompany.com/pdf/KHC_EEO1_2023_Consolidated%20Report.pdf | ||||||||
| The Kroger Co. | Kroger, 8451, Baker's, City Market, Dillon's, Food4Less, Foods Co., FredMeyer, Fry's Food Stores, Gerbesm Harris Teeter, Home Chef, Jay C Food Stores, King Soopers, , Mariano's, Metro Market, Pay Less, Pick n Save, QFC, Roundy's, Ralphs, Ruler Foods, Smith's, The Little Clinic, Vitacost | 2/25/2025 | 16.0 | 8.9 | 0.0 | 0.0 | 20.0 | No | Yes | Yes | 3,580,000,000 | 0 | Not Reported | 0 | Yes | African American | Zero Waste Foundation to enable more frequent food donation pickups benefiting four community food banks: Food Bank of Eastern Michigan (Flint, MI); Houston Food Bank (Houston, TX); Mid-South Food Bank (Memphis, TN); and the Atlanta Community Food Bank (Atlanta, GA). | https://www.thekrogerco.com/wp-content/uploads/2024/11/Kroger-Co-2024-ESG-Report.pdf | https://s202.q4cdn.com/463742399/files/doc_downloads/gov_docs/2024/EEO-1-Reports.pdf | |||||||||||
| L'Oreal | Lancome Paris, Kiehl's, Giorgio Armani Beauty, Yves Saint Laurent, Biotherm, Helena Rubinstein, Shu Uemura, it Cosmetics, Urban Decay, Ralph Lauren, Mugler, Vikto & Rolf, Valentino, Cacharel, Azzaro, Diesel, Yuesai, Atelier Cologne, Maison Margiela, Prada, Youth to the People, Takami, Carita, Aesop, Garnier, Maybelline New York, NYX, 3CE, Essie, Dark & Lovely, Mixa, Magic Mask, Niely | 0.0 | 0.0 | 200.0 | 0.0 | 0.0 | No | 0 | 0 | Not Reported | 200,000 | Launch of its 2024 Inclusive Beauty Fund, which provides financial support and resources to small businesses and entrepreneurs across the beauty industry. Administered in collaboration with the NAACP’s Economic Empowerment Fund and Hispanic Federation, respectively, L’Oréal has partnered with GlobalGiving to provide 40 one-time grants to small businesses and entrepreneurs in the beauty industry across the United States. The NAACP and Hispanic Federation will each award 20 one-time grants of 10,000 each. | https://www.loreal.com/-/media/project/loreal/brand-sites/corp/master/lcorp/3-commitments/for-the-people/respecting-human-rights/publication/loreal-diversity-equity--inclusion-report-2023.pdf?rev=5aac3f64e28d477bb9fb8db63e8c3e76&hash=EE2A0E86776DFE78BBAE0D5D5D14FD98 | |||||||||||||||||
| Lowe's | Lowe's | 3/1/2025 | Yes | 15.4 | 11.7 | 18.0 | 44.4 | 30.8 | Yes | Yes | Not Reported | 0 | 0 | Not Reported | 1,200,000 | Yes | Lowe's Black Business Resource Group | Yes | In 2023, Lowe's and the Charlotte Hornets joined forces with the county and the historically Black Grier Heights neighborhood to revitalize the Grier Heights amphitheater. This was a capstone project in a three-year place-based approach to neighborhood revitalization through the Hornets Legacy Project, powered by Lowe's. | In 2023, the Lowe’s Foundation announced a five-year, $50 million commitment to train 50,000 job-ready skilled tradespeople to build a stronger infrastructure that supports our communities for the long term. The Foundation awarded nearly $11 million in Gable Grants in 2023 to 11 community and technical colleges and three national nonprofit partners. Grantees included Goodwill Industries International, the Local Initiatives Support Corporation (LISC) and the National Center for Construction Education and Research (NCCER). | In 2023, Lowe's invested over $1.2 million in Habitat for Humanity’s Jimmy and Rosalynn Carter Work Project. Hundreds of our associates joined thousands of community volunteers to build 27 homes in a neighborhood on the west side of Charlotte. | Through a series of unique partnerships, Lowe's has invested more than $10 million over the past two years in select schools — including historically Black colleges and universities (HBCUs) — to provide students with pathways to Lowe’s employment. In 2023, we focused on strengthening our relationships with these partners and delivering on our commitment to students. | https://corporate.lowes.com/sites/lowes-corp/files/2024-11/Lowes_2023_CRR_Tagged_0.pdf | https://corporate.lowes.com/sites/lowes-corp/files/2024-06/Lowe's%202023%20EEO-1%20Disclosure%20Updated%206.24.24%201.pdf | ||||||
| Lyft | Lyft | 3/1/2025 | 0.0 | 0.0 | 200.0 | 33.3 | 10.0 | Yes | Not Reported | Not Reported | 0 | 0 | Not Reported | 0 | Not Reported | UpLyft Forward | No | In partnership with Goodwill, United Way Worldwide, and more partners, we provided over 40,000 rides to or from job interviews, job trainings, or the first few weeks of work (until the individual gets a paycheck to pay for their own transportation). | Lyft deleted their Supplier Diversity (Supply Chain Equity) webpage. | As part of our equity ridership programs, thousands of people across the US are paying as little as $5 for an annual bikeshare membership — that gets them to school, work, appointments, or just allows them to explore their city. Our income-eligible riders take 63% more rides overall than standard members, and 85% of these riders are members of a community of color. | https://drive.google.com/file/d/1O1VspZTOH3c5DICgVcbqs6yCpKVUhP6i/view | https://s27.q4cdn.com/263799617/files/doc_downloads/esg/2023/ESG-2023-Report-Final.pdf | ||||||||
| Macy's Inc. | Bloomingdale's, Macy's | 20.0 | 13.0 | 9.0 | 18.2 | 7.7 | No | Yes | Yes | 805,000,000 | 41,000,000 | 5.09% | 4,750,000 | No | Donated 1.6 million to UNCF Funding scholarships for students at HBCUs | https://s202.q4cdn.com/285121676/files/doc_downloads/2024/FINAL-M-2023-Corporate-Responsibility-Report.pdf | ||||||||||||||
| Marathon Petroleum | Arco, Marathon | 3/1/2025 | 5.1 | 3.7 | 0.0 | 0.0 | 13.3 | No | Yes | Yes | 795,000,000 | 0 | Not Reported | 0 | Yes | BLACK | No | Grow Detroit’s Young Talent is on a mission to provide job placement, training, career advisement and other supportive services to Detroit residents ages 14 to 24. To help further this mission, MPC has provided grants to Grow Detroit’s Young Talent and partnered with the organization to develop and deploy a paid workforce development youth program at our Detroit refinery. Each summer, this six-week program accepts 10 Detroit residents interested in careers in refining. Participants receive hands-on refining experience in process operations, waste management, safety and emergency preparedness. In addition to hands-on experience, participants receive soft-skill training and engage in multiple community service projects. | https://www.marathonpetroleum.com/content/documents/Responsibility/Sustainability_Report/2023_SustainabilityReport.pdf | https://www.marathonpetroleum.com/content/documents/Responsibility/Reports_Policies/2024/MPC_2023_EEO-1_Consolidated_Report.pdf | ||||||||||
| Marriott International Co. | The Ritz-Carlton, St. Regis, JW Marriott, The Luxury Collection, W Hotels, Edition, Sheraton, Delta Hotels, Westin, Le Méridien, Renaissance Hotels, Gaylord Hotels, Courtyard, Four Points, SpringHill Suites, Fairfield Inn & Suites, AC Hotels, Aloft HotelsMoxy Hotels, Protea Hotels, City Express, Four Points Flex by Sheraton, Residence Inn, TownePlace Suites, Element Hotels, Autograph Collection, Design Hotels, Tribute Portfolio Hotels, MGM Collection | 3/1/2025 | 19.6 | 12.0 | 6.0 | 9.5 | 23.1 | No | Yes | Yes | 0 | 0 | Not Reported | 0 | Yes | Yes | No | Tier 1 & Tier 2 SD Spends: $700+ million spent with diverse suppliers Diverse Supplier Category Spend; Minority-owned $455,000,000 | Marriott is a sponsor of WBENC’s Women of Color Incubator, which provides the next generation of Black women entrepreneurs with resources and support to strengthen their ideas and grow their early-stage ventures. | The J. Willard and Alice S. Marriott Foundation and Marriott made a $550,000 contribution to support the AHLA Foundation’s No Room for Trafficking Survivor Fund. The contribution will be used for grants to community-based organizations that provide financial support and stability to human trafficking survivors. | 2021: Howard University received a $20 million endowment gift from the J. Willard and Alice S. Marriott Foundation to launch the Marriott-Sorenson Center for Hospitality Leadership in the School of Business. The company continues to move forward with the Marriott-Sorenson Center for Hospitality Leadership at Howard University (Washington, D.C., U.S.), and in 2023, 19 students will be part of the Center’s inaugural cohort. Marriott also launched a Guest Lecturer Series at the University featuring Marriott executives presenting sessions focused on hospitality as a career. | https://serve360.marriott.com/wp-content/uploads/2024/07/2024ESGProgress.pdf | https://marriott.gcs-web.com/static-files/05c8911f-0b0c-46b7-8dc6-465308d4c502 | |||||||
| Mars, Inc. | Cesar, Eukanuba, Greenies, Iams, Nutro Feed Clean, Pedigree, Royal Canin, Sheba, Whiskas, 3 Musketeers, 5 Gum, Altoids, American Heritage, Balisto, Bounty, Celebrations, Combos, Doublemint, Dove (Chocolate), Hubba Bubba, Juicy Fruit, Kind, Life Savers, M&M's, Mars, Milky Way, Orbit, Skittles, Snickers, Starburst, Wrigley's | 3/1/2025 | 0.0 | 0.0 | 200.0 | 0.0 | 200.0 | No | Yes | Not Reported | 0 | 0 | Not Reported | 0 | Yes | Mars African American Council (MAAC) | No | We also partnered with Delta Group, Molina Healthcare, and The Community Foundation of Washington to create The Washington County Food Access Improvement Fund, which provides long-term support for food pantries and nonprofit organizations with a $400,000 commitment to provide 20,000 healthy meals to Washington County residents in Mississippi over next three years. | https://www.mars.com/sites/g/files/dfsbuz106/files/2024-07/2023%20Sustainable%20in%20a%20Generation%20Report_5.pdf | |||||||||||
| Mattel | Barbie®, Hot Wheels®, Fisher-Price®, American Girl®, Thomas & Friends®, UNO®, Masters of the Universe, Matchbox, Monster High, MEGA, Polly Pocket, Barney, Bob the Builder, Guts!, Mad Gab, Pictionary, Scrabble | 3/1/2025 | 6.9 | 4.3 | 0.0 | 0.0 | 10.0 | No | Not Reported | Not Reported | 0 | 0 | Not Reported | 0 | Not Reported | Black at Mattel | No | Mattel removed their 2022 Citizenship report. No current reporting has been provided. | https://assets.contentstack.io/v3/assets/bltc12136c3b9f23503/blt9979615aa592c0a4/66a7dc14a4a65794b91ddadd/EEO-1_Data_Disclosure_(FY_2023_-_Final).pdf | |||||||||||
| McDonald's | McDonald's | 3/3/2025 | Yes | 19.0 | 12.0 | 12.5 | 7.7 | 16.7 | No | Not Reported | Not Reported | 0 | 0 | 4.10% | 1,000,000 | 100% | Yes | The McDonald’s Black Employee Network (BGLDN) | No | 12% of Approved Owner/Operators (Franchisees) are Black (36.4% of Diverse-Owned Franchises). | 4.1% of Supplier Diversity spend with Black suppliers (15.6% of the total Diverse-Owned Supplier Spend). | 4.6% of U.S. Marketing Investment Spend with National Black-Owned Media and Production Companies and Content Creators (34.3% of total Diverse Marketing Investment) | $1 million to support the Founder’s Circle of Operation HOPE, an organization whose mission is to expand economic opportunity in underserved communities through financial education and empowerment by offering programs that create stabilized communities and financial stakeholders. | In 2021, McDonald’s partnered with the Thurgood Marshall College Fund (TMCF), to create the Black & Positively Golden® Scholarship Program. The initiative supports bright young minds headed to the nation’s HBCUs (Historically Black Colleges & Universities). In 2024, the B&PG Scholarship Program awarded $1 million in HBCU scholarships to more than 60 scholars. | https://corporate.mcdonalds.com/content/dam/sites/corp/nfl/pdf/McDonalds_PurposeImpact_ProgressReport_2023_2024.pdf | https://corporate.mcdonalds.com/content/dam/sites/corp/nfl/pdf/McDonalds_Diversity_Snapshot-2023-2024.pdf | https://corporate.mcdonalds.com/content/dam/sites/corp/nfl/pdf/McD_EEO1_Data_Table_2023.pdf | |||
| Meta | Facebook, Instagram, What's App | 3/3/2025 | Yes | 3.5 | 3.1 | 4.5 | 0.0 | 15.4 | No | Not Reported | Not Reported | 0 | 0 | Not Reported | 0 | Not Reported | Not Reported | No | In 2024, Meta announced the elimination of DEI programs. Since then, all past reporting has been removed from their website. | https://s21.q4cdn.com/399680738/files/doc_downloads/2024/09/meta-eeo-1-certified-reports_consolidated_2023.pdf | ||||||||||
| Microsoft | Activision, Blizzard, King, GitHub, LinkedIn, Call of Duty, Crash Bandicoot, Candy Crush, World of Warcraft, Spyro Reignited Trilogy, Sekiro: Shadows Die Twice, Diablo, Tony HawkOverwatch, StarcraftBubble Witch SagaFarm Heroes Saga, Diamond Diaries Saga, Pet Rescue Saga | 3/3/2025 | 6.4 | 4.4 | 4.9 | 0.0 | 8.3 | No | Yes | Yes | 18,000,000,000 | 0 | Not Reported | 0 | 100% | Since 2020, we’ve contributed nearly $16 million benefitting 32 historically Black colleges and universities (HBCUs) | Blacks at Microsoft (BAM) | No | Black Microsoft employees in the U.S. earn $1.00 for every $1.00 earned by white employees when performing the same job at the same level (pay equity); However, Black employees’ median pay is 79.6% of the median for white employees, reflecting underrepresentation in senior and higher-paying roles rather than direct pay discrimination. | Through our Racial Equity Initiative, TEALS accelerated to expand access and is now providing computer science education to high school students in nearly 550 schools across 21 racial equity expansion regions with the support of 1,500+ volunteers, 12 percent of whom identify as Black or African American. The program is projected to expand to a total of 600 schools for the 2024-2025 school year. | Another way we increase access is through our Nonprofit Tech Acceleration (NTA) program, committed to increasing technology access for “At Microsoft Philanthropies, our mission is to empower people, nonprofits, and communities with the digital and AI capabilities they need to drive inclusive economic growth. By democratizing access to technology, we’re not just expanding opportunities, but also helping to create a more equitable and inclusive society. Our commitment is to ensure that everyone, regardless of background, has the tools to thrive in the digital economy.” Kate Behncken, Corporate Vice President and Global Head of Microsoft Philanthropies nonprofit organizations that serve historically underrepresented communities. To help digitally transform nonprofits in underserved communities, we have provided support to more than 537 nonprofits serving Hispanic and Latinx communities and helped streamlined operations with technical solutions impacting over 1,900 Black and African American communities. | In partnership with The Martin Luther King Jr. Center for Nonviolent Social Change (The King Center), Microsoft is honored to digitize the world’s largest collection of primary source material related to Dr. Martin Luther King Jr., and the American Civil Rights Movement. Through this partnership, we have supported the creation and launch of The Coretta Scott King Rose Gallery, which offers a unique glimpse into the life of Coretta Scott King, the visionary behind the King legacy. More than just a virtual museum, the gallery is an immersive journey that connects the past with the present, inviting audiences to explore the legacy of a remarkable woman who dedicated her life to social justice and peace. | The Talent, Learning, Diversity, and Inclusion (TDIL) Team partnered with Blacks at Microsoft (BAM) to host events as a part of Microsoft’s sponsorship of Afrotech, an annual event for Black and African American tech professionals, start-ups, and entrepreneurs. BAM Leadership led a session focused on how to support one another and request support from managers in the workplace and hosted a networking event to grow and build connections for the 238 Microsoft employees in attendance. | In partnership with Stillman College and Black Tech Futures Research Institute, advised the National Science Foundation on a framework for equitable AI and responsible computing funds. | https://cdn-dynmedia-1.microsoft.com/is/content/microsoftcorp/microsoft/msc/documents/presentations/CSR/2024-Microsoft-Impact-Summary.pdf | https://cdn-dynmedia-1.microsoft.com/is/content/microsoftcorp/microsoft/dni/documents/presentations/microsoftcorp_gdi_report_2024_final.pdf | Downloaded | |||
| Morgan Stanley | Morgan Stanley | 3/5/2025 | Yes | 7.8 | 6.8 | 4.7 | 16.7 | 15.4 | No | Yes | Not Reported | 0 | 0 | Not Reported | 0 | Not Reported | Spelman College Delaware State University | Black Employee Network | No | The Morgan Stanley HBCU Scholars Program provides needs-based four-year scholarships for students at Howard University, Morehouse College and Spelman College, HBCUs in the United States. Currently in its third year, the retention rate for scholars in the program is 97%. | The Morgan Stanley Richard B. Fisher (RBF) Scholarship Program helps to attract candidates from historically underrepresented groups to the financial services industry. Since its founding in 1993, the RBF Scholarship Program has distributed close to $11 million in scholarships to over 750 students across the United States. | Partnerships with the National Association for Black Accountants, the National Black MBA Association, and Afro Tech. | https://www.morganstanley.com/content/dam/msdotcom/en/assets/pdfs/Morgan_Stanley_2023_ESG_Report.pdf | |||||||
| Nationwide | Nationwide | 3/4/2025 | 0.0 | 0.0 | 200.0 | 200.0 | 200.0 | No | Not Reported | Not Reported | 0 | 0 | Not Reported | 0 | Not Reported | Yes | Not Reported | No | Nationwide is a member of the Financial Alliance for Racial Equity (FARE) coalition, which launched an HBCU Mentorship Program Pilot in 2023, to support Black students and young professionals with career growth and professional development opportunities. | Strategic Partnerships with The Executive Leadership Council, National Black MBA Association, Black Enterprise, National Urban League, Black Enterprise Women of Power Summit | https://www.nationwide.com/cps/annual-report/corporate-sustainability.html | |||||||||
| Saks Global | Saks Fifth Avenue, Nieman Marcus, Bergdorf Goodman, Saks Off 5th | 3/1/2025 | 0.0 | 0.0 | 200.0 | 0.0 | 200.0 | No | Not Reported | Not Reported | 0 | 0 | Not Reported | 0 | ONYX @Saks | No | 100+ Black-owned, -designed and -led brands added | |||||||||||||
| Netflix | Netflix | 3/4/2025 | 9.0 | 9.4 | 11.9 | 5.0 | 15.4 | No | Yes | Not Reported | 600,000,000 | 0 | Not Reported | 140,000,000 | 99% | Not Reported | Black@Netflix | No | In 2020, we announced that we planned to move 2% of our cash holdings — initially up to $100 million — into Black banks and similar financial institutions to help create economic opportunities for Black communities in the US. After we fulfilled our initial pledge, we expanded that investment to 2% of our cash and short-term investment holdings. As of December 31, 2023, we’ve committed $140 million. | In 2020, we worked with LISC Fund Management (LFM) to create the Black Economic Development Fund (BEDF) with a seed investment of . The Fund is designed to address economic challenges in the Black community and help close the racial wealth gap. Over the last three years, BEDF has grown into a $250 million mission-driven fund investing in Black-led developers, financial institutions, anchor organizations and businesses, with a goal of growing these organizations and strengthening their contributions to the Black community. From inception to the end of 2023, Netflix contributions supported BEDF’s investment of nearly $212 million in black-led transactions: $17 million in deposits to Black-owned banks; $29 million to Black-owned businesses; and over $166 million in Black-led real estate developers. | Hope Credit Union was one of the first investments we made to build economic opportunity in Black communities. Since then, we’ve supported the financing of more than 2,500 entrepreneurs, homebuyers and consumers of color. | https://s22.q4cdn.com/959853165/files/doc_downloads/2024/6/2023-Netflix-Environmental-Social-Governance-Report.pdf | https://s22.q4cdn.com/959853165/files/doc_downloads/eeo-1_reports/2024/EEO-1-Certified-Report-2023.pdf | |||||||
| Nike | Converse, Jordan Brand, Nike | 25.4 | 0.0 | 6.7 | 18.2 | 23.1 | No | Yes | 395,000,000 | 0 | Not Reported | 15,200,000 | Yes | Black Community Commitment: As part of NIKE’s FY23 15.2 million contribution to the Black Community Commitment, Nike directed 10.1 million to BCC national and local grantees in the U.S. that are focused on addressing racial inequality for Black Americans through economic empowerment, education innovation and social justice reform. | ||||||||||||||||
| Nordstrom | Nordstrom | 3/1/2025 | 20.0 | 13.0 | 7.0 | 9.1 | 9.1 | No | Yes | Not Reported | 0 | 0 | Not Reported | 0 | Yes | Black Employee Network | No | Our early in career programs aim to attract qualified candidates who reflect the diversity of the communities we serve. In 2023, we leveraged our Retail Leadership Training Program and other initiatives to help reach a diverse representation of qualified candidates early in their careers. 52% of our interns/trainees were from an underrepresented group, with 28% identifying as Black, Hispanic or Latinx. We also launched Nspire, an early exposure program that introduces sophomore college students to careers at Nordstrom. | $190 million in retail sales from brands owned, operated or designed by Black, Hispanic or Latinx individuals. Founded by real-life sisters Robin McBride and Andréa McBride John, McBride Sisters Wine Company, served in 88 of our locations, is the largest Black-owned and women-founded wine company in the United States. We signed the Fifteen Percent Pledge in 2021 and have continued our ambition to buying 10x more merchandise from Black-owned or -founded businesses by 2030. In 2023, our total offering of Black, Hispanic and Latinx-owned or -founded brands reached 231. We conducted our second annual Black Business Month campaign in August where we supported and recognized Black businesses nationwide and expanded our #BuyBlack Market pop-ups to 12 Nordstrom stores. Curated in partnership with The Fifteen Percent Pledge, we invited local businesses to pop up with us throughout the month in New York City, Atlanta, Charlotte, Durham, Houston, Dallas, Chicago, Los Angeles, Seattle, Miami and Washington, DC. | We sponsored ICON360’s inaugural HBCU Professor Retreat in New York, which facilitated discussions on talent pipelines, teaching methods and industry opportunities. We partnered with Morehouse College, an HBCU in Atlanta, where we supported the launch of a new product management track. We organized a 12-session Talent Consortium in partnership with HBCU First, the leading internship and mentoring program for over 70 HBCUs. The sessions covered topics such as career development, leadership skills and networking strategies to upskil | “A Seat at the Table: A Black Leadership Panel” Discussion - Black Employee Network hosted a virtual panel discussion highlighting the career journeys of Black leaders at Nordstrom and the importance of mentorship. | Good+Foundation: Since 2019, Nordstrom has partnered with Good+Foundation, an organization that seeks to dismantle multigenerational poverty by pairing tangible goods with innovative services for low-income parents across the U.S. Started in NYC, Good+Foundation originally focused on giving new life to gently used baby products for expecting families. Now, they partner with companies like Nordstrom to give new products to low-income families and have become a leading partner for diaper banksacross the U.S. Nordstrom gave over $4,650,000 in products and programmatic support to Good+Foundation in 2023 and we are excited to bring more to expecting families in 2024 with a focus on product donations and direct support for Good+Foundation programming. | https://n.nordstrommedia.com/it/048e775c-a106-4feb-8e1c-e907a61b4136.pdf?jid=j013046-22862&cm_sp=merch-_-jwn-csr:_corporate_social_responsibility_22862_j013046-_-freelayout_0_p01_0& | |||||||
| Peloton | Peloton | 3/4/2025 | 12.6 | 0.0 | 9.0 | 33.3 | 16.7 | No | Yes | Yes | 0 | 0 | Not Reported | 0 | Yes | Not Reported | Black@Peloton | No | Maintained Management Leadership for Tomorrow’s (MLT) Black Equity at Work Silver Certification We entered our third year as program participants steadfastly committed to racially equitable talent, recruitment, retention, and DEI practices. | GirlTREK is America’s largest nonprofit focused on the health of Black women and girls. The organization aims to inspire its network of over 1.3 million Black women and girls to use daily walks as a practical healing tool for combating inactivity, isolation, and injustice. The organization’s walking events and challenges have led to increased physical activity among GirlTREK members. In FY24, GirlTREK reached more than 1.22 million individuals. Peloton’s investment helped support the purchase of Bricklayers Hall in Montgomery, Alabama, to serve as the organization’s new southern headquarters; a virtual convening that brought over 17,000 GirlTREK members together on Harriet Tubman Day; and community campaigns including the annual Black Family 5K. | In Atlanta, we teamed up with Spelman College, a historically Black college for women, and our Pledge partner GirlTREK, an organization focused on bringing health and happiness to Black women through walking together. Together, we hosted a Gospel Yoga Flow class led by Dr. Chelsea Jackson Roberts, followed by a panel discussion on the power of movement and strong social support. The events centered on creating space for Spelman students to come together and celebrate the power of movement and community. The panel featured three speakers: Spelman College alumna and Peloton yoga and meditation Instructor, Dr. Chelsea Jackson Roberts; Peloton Tread Instructor and Instructor Ambassador for GirlTREK, Kirsten Ferguson; and GirlTREK’s National Campus College Recruiter, Nyra Govan. | Since launching EISD within our Procurement team in 2021, our spend with diverse suppliers has risen to 3%, as of FY24. | Peloton’s investments in J.P. Morgan’s Empowering Change program have provided direct revenue to minority depository institutions (MDIs) and community development financial institutions (CDFIs)—fostering sustainable revenue streams and economic opportunities. Peloton’s investment has benefited numerous MDIs and CDFIs, enabling them to amplify impact in minority and/or low- to moderateincome communities. By participating in these innovative programs, partner banks have been able to deploy additional loans for small, minority-owned businesses, invest in community development projects, introduce new technology to help them better serve clients, expand financial inclusion to unbanked or underbanked households, and grow and develop their teams. | https://investor.onepeloton.com/static-files/54cdd509-b81d-4289-a0af-2f110ee0ae84 | ||||||
| PepsiCo | 22.9 | 12.4 | 7.7 | 10.0 | 20.0 | No | 1,000,000,000 | 0 | Not Reported | 0 | No | Our multi-faceted Pepsi Dig In platform, including the PepsiCo Foundation’s Black Restaurant Accelerator (BRA), continues to strengthen Blackowned businesses with access to business-building resources, such as Black Restaurants Delivered, and innovative initiatives to drive visibility and sales. Through 2022, we invested 22.3 million USD in Blackowned restaurants. Additionally, BRA – the PepsiCo Foundation’s joint initiative with the National Urban League, achieved a milestone of providing grants to its first 100 of 500 Black restaurateurs in 11 cities across the U.S. In addition to achieving this milestone, BRA has supported 400 more Black-owned restaurants by providing business-building support, including counseling and training sessions, and helped provide access to approximately 1.6 million USD of financing and contract opportunities. | Taste Of Tomorrow: PepsiCo Foundation is providing $250,000 in scholarships to HBCU students pursuing STEM degrees across 9 HBCUs for the 2025 school year. Beginning September 9, 2024, through December 2, 2024, students at Benedict College, Bethune-Cookman University, Florida A&M University, Hampton University, Howard University, Jackson State University, Morgan State University, North Carolina Central University and Prairie View A&M University can apply at https://learnmore.scholarsapply.org/tasteoftomorrow. Participating schools and application requirements can also be found at the link during the live application period. | Additionally, PepsiCo is honoring and supporting Florida A&M University and Prairie View A&M University by providing $100,000 total for STEM resources to enhance their programs and foster innovation for long-term advancement of their programs and bringing an R&D educational workshop series to their campuses for further access. | https://www.pepsico.com/docs/default-source/sustainability-and-esg-topics/2023-esg-summary/2023-esg-performance-metrics.pdf?sfvrsn=a2c3df64_1 | |||||||||||||||
| Pernod Ricard | Absolut, Ballantine's Beefeater London, Chivas Regal, Havana Club, Jameson, Malibu, Ojoi De Tigre, Martell Cognac, GH Mumm, Champagne Perrier Jouet, Ricard, Royal Salute, The Glenlivet, Aberlour Distillery, Olmeca Altos, Cognac Augier, Avion Tequila, Spot Whiskey, Italicus, Jefferson's Bourbon, Lillet, Lot No. 40 Canadian Rye Whisky, Method and Madness, Midleton, Seagram's, Kahlua, Jacob's Creek, Kenwood Vineyards | 3/3/2025 | 0.0 | 0.0 | 200.0 | 0.0 | 0.0 | No | 0 | 0 | Not Reported | 0 | Yes | No | 2023: A Black former employee’s case against liquor company Pernod Ricard USA won’t go to trial due to lack of direct evidence of discrimination based on race, a federal judge decided. Michele James sued Pernod alleging that it passed her up for promotion to a director position. She sued under the New York City Human Rights Law, claiming that the company’s decision to hire someone else instead of promoting her was racially motivated. She cited a conversation between her and the hiring manager in which the latter said they couldn’t see her in the director position. | |||||||||||||||
| Procter & Gamble | Charlie Banana, Luvs, Ninjamas, Pampers, Ariel Bounce, Cheer, Downy, Dreft, Era, Gain, Rindex, Tide, Bounty, Charmin, Puffs, Always, Just, Tampax, L., Braun, Gillette, Joy + Glee, Venus, The Art of Shaving, Aussie, Head & Shoulders, Herbal Essences, My Black is Beuatiful, Old Spice, Pantene, Ambi Pur, Cascade, Dawn, Febreze, Gain, Microban 24 Hour, Mr. Clean, Salvo, Swiffer, Zevo, Crest, Fixodent, Oral-B, Scope, Align Probiotic, Clearblue, Metamucil, Pepto Bismol, Prilosec, Vicks, Ivory, Native, Olay, Safeguard, Secret, SK-II | 3/4/2025 | 12.1 | 10.0 | 13.0 | 8.6 | 14.3 | No | Yes | Yes | 0 | 0 | Not Reported | 0 | Yes | African Ancestry Leadership Network (AALN) | No | P&G's long-time partnership with the United Negro College Fund (UNCF) supports young people from underrepresented groups to become highly qualified college graduates and provides a critical pipeline of talent needed to drive innovation that reflects and serves P&G’s diverse consumer base. The longstanding relationship has enabled brands such as Tampax, Olay and My Black is Beautiful to build more consumer-focused programs in collaboration with our retail partners with whom we serve this community of consumers. | An estimated 20 million viewers tuned in for the 2023 edition and to date more than $14 million dollars has been raised for a diverse collection of beneficiary partners, including The National Black Justice Coalition. Can’t Cancel Pride continues to unite the LGBTQ+ community by celebrating visibility and inclusivity for all. | https://assets.ctfassets.net/oggad6svuzkv/5OoVbOiodqQWby9fGbPE14/23441453b36c8ab1b0de7a75aa0631fc/2022-2023_Consolidated_Report.P_G_final.pdf | ||||||||||
| Progressive | Progressive | 3/4/2025 | 22.5 | 10.8 | 3.6 | 16.7 | 18.2 | No | Yes | Not Reported | 0 | 0 | Not Reported | 200,000 | 100% | Yes | Progressive African American Network | No | Working with strategic partners to reach a more robust pool of diverse talent for leadership and mid-level professional roles. In our continued efforts, we’ve established a new partnership starting in 2024 with Jopwell, a career advancement organization for Black, Latinx, and Native American students and professionals. | We’re excited to create new and expanded relationships with certified small and diverse suppliers through our Supplier Diversity Program, fully launching in 2024. | In 2023, Progressive donated $1.45 million directly or through the Foundation to the national charities identified by our ERGs. Progressive African American Network (PAAN) began supporting and collaborating with Big Brothers Big Sisters of America (BBBS) in late 2023, and we’re excited to work with them in the coming years. This marks a major accomplishment for PAAN, which is better able to carry out the empowerment and education pillar of its mission through BBBS’ mandate to foster one-to-one mentoring relationships, particularly within the African American community. | https://s202.q4cdn.com/605347829/files/doc_downloads/2024/10/progressive_2023corporatesustainabilityreport_a.pdf | https://www.progressive.com/content/pdf/support/EEO-1_2023.pdf | |||||||
| Publix | Publix | 3/3/2025 | 0.0 | 0.0 | 200.0 | 200.0 | 200.0 | No | Not Reported | Not Reported | 0 | 0 | Not Reported | 0 | Not Reported | Publix Charities donated to the YMCA of Greater Birmingham to support two programs: one for youth and teen development and one for the Roebuck community project. | https://publix.widen.net/view/pdf/8xckqfj09d/CSR-Report.pdf | |||||||||||||
| Puma | Puma, Cobra Golf, stichd | 0.0 | 0.0 | 200.0 | 0.0 | 14.3 | No | 0 | 0 | Not Reported | 0 | In 2023, we educated and preserved culture and history through our work with BLACK FIVES and its NY RENS 100 collection launched in November with court refurbishments and street dedications (Harlem Rens 100th Anniversary). | ||||||||||||||||||
| RBI | Tim Horton's, Burger King, Popeye's, Firehouse Subs | 3/1/2025 | 6.0 | 0.0 | 3.0 | 0.0 | 10.0 | No | Yes | Not Reported | 0 | 0 | Not Reported | 0 | Not Reported | Not Reported | No | 10% of new hires were Black. | In September 2022, Tim Hortons announced a 5-year, C$5 million partnership with Justice Fund in support of Black, Indigenous, and youth of colour from under-resourced communities in Toronto. | The Burger King Foundation has awarded $6.7 million USD to Black students since 2011. | https://s26.q4cdn.com/317237604/files/doc_downloads/2024/08/2023-Restaurant-Brands-for-Good.pdf | |||||||||
| Spotify | Spotify | 3/6/2025 | 7.4 | 0.0 | 200.0 | 0.0 | 10.0 | No | Not Reported | Not Reported | 0 | 0 | Not Reported | 0 | Not Reported | Spelman College, Howard University, and Hampton University | BLK | No | Spotify’s destination for celebrating Black art, entertainment, creativity, culture, and community— both on and off platform—works to create a space that represents the wide spectrum of Black artistry. | 4A’s Foundation x Spotify Pulse Fellows Year Two: a cocreated, yearlong creative development program for Black professionals with one to three years of experience in the advertising industry. To bring it to life, we partnered with programs that are already doing inspiring work supporting, developing, and empowering Black creatives, like MAIP (Multicultural Advertising Intern Program), D&AD Shift, Marcus Graham Project, ONE School, and our newest program partner, BLAC Internship. | With support from the (CEF), Spotify has expanded NextGen to support historically Black college and university (HBCU) campuses including Spelman College, Howard University, and Hampton University. We offer a relevant podcast curriculum and programming that allow us to discover new and different voices, stories, and perspectives. Through our NextGen partnerships, we also established a scholarship fund for students interested in the audio industry, donated state-of-the-art audio equipment, and coproduced audio content created by students. | The Spotify x PLUS1 for Black Creatives Fund Scholars Program provides renewable threeyear need-based scholarships and leadership development components to Black students attending HBCUs (historically Black colleges and universities) with an interest in pursuing a career in media. In 2023, the second cohort of 20 Spotify scholars was selected for this program. | The Spotify x PLUS1 for Black Creatives Fund Frequency Scholarship Program provides renewable two-year need-based scholarships to Black students attending any accredited college or university interested in pursuing a career in music. In 2023, the second cohort of eight Spotify scholars was selected for this program. | https://www.lifeatspotify.com/reports/Spotify-Equity-Impact-Report-2023.pdf | ||||||
| Starbucks | Starbucks | 3/5/2025 | Yes - Removed DEI Goals from Executive Compensation | 8.2 | 7.8 | 13.9 | 7.1 | 0.0 | No | Yes | Yes | 1,000,000,000 | 0 | Not Reported | 0 | 100% | Not Reported | Not Reported | No | In 2022, Starbucks continued to leverage the power of publicprivate partnerships and joined the Economic Opportunity Coalition to address economic disparities and accelerate economic opportunity in historically marginalized communities by developing and collaborating on new services, programs and products that will support deploying resources where they are most needed. | https://about.starbucks.com/uploads/2025/02/FY2023-Starbucks-Global-Impact-Report.pdf | https://about.starbucks.com/uploads/2024/08/EEO-1-2023.pdf | ||||||||
| State Farm | State Farm | 3/5/2025 | 0.0 | 0.0 | 200.0 | 11.1 | 21.4 | No | Not Reported | Not Reported | 0 | 0 | Not Reported | 0 | Not Reported | Not Reported | African American Forum (AAF) | No | State Farm and the Atlanta Hawks NBA basketball team hosted their 2023 Million Meal Pack at State Farm Arena. Over 5,000 community volunteers (including more than 900 State Farm employees and over 20 State Farm agents) packed over 1 million meals for distribution to Metro Atlantans through various community food bank organizations. | https://impact.statefarm.com/data/docs/2023/2023_Impact_Report.pdf | ||||||||||
| Stellantis | Abarth, Alfa Romeo, Chrysler, Citroen, Dodge, DS Automibiles, Fiat, Jeep, Lancia, Maserati, Open, Peugeot, Ram, Vauxhall, Free2Move, Leasys | 36.7 | 0.0 | 200.0 | 3.3 | 0.0 | No | 0 | 0 | Not Reported | 0 | Yes | Graduate Case Competition of the National Black MBA Association 15 Stellantis has been the exclusive sponsor of the Graduate Case Competition since 1995, with nearly 5,000 students participating over the years. The National Black MBA Association/Stellantis Graduate Case Competition is an annual event that gives high-potential graduate students an opportunity to demonstrate their knowledge and problem-solving skills in a formal competition. Talented MBA candidates from 20 of the U.S. top business schools competed for $50,000 in scholarships . For the 2023 NBMBAA Business Case, students were tasked to represent a consulting firm that will develop a U.S. marketing strategy that builds awareness, vehicle-buying consideration, long-term brand affinity and loyalty among Black consumers for Dodge, one of the iconic brands in the Stellantis portfolio. | Over $7 Billion spent with Tier 1 & 2 diverse suppliers | Stellantis 2023 CSR Report | |||||||||||||||
| Synchrony Financial | Synchrony Bank | 3/3/2025 | 19.0 | 14.0 | 11.5 | 13.3 | 18.2 | No | Yes | Yes | 0 | 0 | Not Reported | 100,200,000 | 99% | Yes | Black Experiences+ | Yes | In February 2023, we announced a $100 million commitment in Ariel Alternatives’ (the private equity subsidiary of Ariel Investments, LLC) Project Black, which aims to create jobs, economic growth and equality with underrepresented populations from the entry level to the boardroom. Our investment will help give Black, Hispanic and women entrepreneurs more of the support they need to grow long-term. To date, we have funded over 20% of our pledge. In addition to our financial pledge, our team continues to partner by supporting Project Black’s diligence efforts. Synchrony is dedicated to providing the resources and expertise to advance equity for diverse businesses and communities and continuing to do more even as we continually assess and work toward closing gaps around our diverse spending. | With one of our significant suppliers, we co-sponsored an inaugural cohort of 21 suppliers through a six-week development program in which the suppliers participated in courses at Georgia State University designed to increase their knowledge of banking and Fintech and provide practical insight into the unique requirements for suppliers seeking to do business within the financial services sector. | Dedicated to advancing the global Black community by developing leaders, informing policy and educating the public, the Congressional Black Caucus Foundation (CBCF) promotes financial empowerment and provides leadership development and scholarship opportunities to educate the emerging of Black leaders. For two consecutive years, Synchrony has participated in the CBCF’s C-Suite Internship Program, in which we hosted two post-graduate students as interns to learn about the intersection of public policy and the private sector. During the CBCF’s Annual Legislative Conference (“Securing Our Democracy. Protecting Our Freedoms. Uplifting Our Culture.”), Synchrony and our BE Network+ participated in conversations about how to best support HBCU (Historically Black Colleges and Universities) students, financial literacy and access to healthcare. The event culminated with the Phoenix Awards Gala, with remarks from the President and Vice President of the United States. | Since 2021, our Education as an Equalizer investments have reached 18,830 people and generated over 24,600 social impacts thus far. 35.2% of their investment has gone to people of African descent (6,505 Black). | BE+ partnered with Tuskegee University College of Veterinary Medicine, a historically black college/university (HBCU) in Alabama, to help increase educational and training opportunities for veterinary students and expand pathways for increased diverse representation in the veterinary industry. Tuskegee is the only HBCU in the U.S. that offers a veterinary medical professional program; TUCVM has educated more than 70% of the nation’s Black veterinarians. Our partnership with TUCVM started with Synchrony’s Health & Wellness Pet Team. Synchrony has been supporting TUCVM since 2021 through multi-year grants totaling $400,000 which provide educational and training opportunities for their veterinary students and creates opportunities for increased diversity within the field. Additionally, our team heard the school wanted to create a promotional video as part of a program to raise awareness and drive enrollment. Synchrony employees from our marketing and creative teams immediately jumped in to make it happen. A team of employees pulled together resources and produced the video pro bono. They simply wanted to help the college succeed, so its students can succeed. | https://synchronydiversityreport.com/downloads/Synchrony_2023_EDIC_Diversity_Report.pdf | ||||||
| T-Mobile, Inc. | T-Mobile, Mint Mobile, Metro by T-Mobile, Ultra Mobile | 3/1/2025 | 19.3 | 15.0 | 7.0 | 0.0 | 7.1 | No | Yes | Not Reported | 3,100,000,000 | 0 | Not Reported | 0 | Yes | Not Reported | No | To provide mentorship to underrepresented talent applying to roles in Corporate Communications and Technology, we developed a new partnership with Mentor Spaces in 2023. Through the partnership, our employees engage in skills-based career mentorship with students from Historically Black Colleges and Universities (HBCUs) and Hispanic Serving Institutions (HSIs), developing relationships to help students successfully navigate future career opportunities. | 2023: 25.5% of new hires were Black. | Launched in 2021 and still growing, the NextTech Diversity Program offers career training and job placement for candidates from traditionally underrepresented backgrounds. With a focus on recruiting, training, and certifying network technicians and equipment drivers — roles critical to our 5G world — the program is a key investment in building the telecommunications sector talent pipeline and developing a more equitable supply chain. Since inception, the program has funded 395 candidates, which included 175 in 2023. | In 2023, we continued to award scholarships to business owners, including those from traditionally underrepresented backgrounds, through our T-Mobile Supplier Mentor Protégé Program. | https://www.t-mobile.com/content/dam/digx/tmobile/us/en/non-dynamic-media/pdf/T-Mobile_2023_Corporate_Responsibility_Report.pdf?icid=MGPO_TMO_U_TMOCPSOCRS_0AAA00919C04722639817 | https://www.t-mobile.com/content/dam/digx/tmobile/us/en/non-dynamic-media/pdf/2023-T-Mobile-EEO1-Report.pdf | |||||||
| Take Two Interactive | Rockstar Games, 2K, Zynga | 4.9 | 3.1 | 0.0 | 0.0 | 10.0 | No | Not Reported | Not Reported | 0 | 0 | Not Reported | 0 | Not Reported | Not Reported | Not Reported | No | https://ir.take2games.com/static-files/d962d030-5d19-42d7-9726-25b8cfb8643d | ||||||||||||
| Tapestry, Inc | COACH, KATE SPADE NEW YORK, STUART WEITZMAN | 16.0 | 8.3 | 5.3 | 0.0 | 18.2 | No | Not Reported | Not Reported | 0 | 0 | Not Reported | 0 | Not Reported | Howard University Bowie State University Clark Atlanta | Black Alliance | No | Coachtopia is building a community with the next generation through multiple educational partnerships and a collaborative working ethos. The Coachtopia Catalyst Fund, created in partnership with 1% For the Planet, is funded by donating 1% of Coachtopia’s annual revenue to catalyze the visionary work of emerging Gen Z climate leaders. Black Girl Environmentalist: a nonprofit organization, in which Coachtopia supported the inaugural launch of their Hazel M. Johnson Fellowship program designed to empower early-career Black women and gender-expansive individuals with getting jobs in the climate sector. | kate spade new york is proud to work with the following partners around the world: - Black Girls Smile - Boris Lawrence Henson Foundation | Nonprofit partnerships with FIT Social Justice Center, Year Up, Thurgood Marshall College Fund, Black Girls Smile, Harlem’s Fashion Row | Diverse sourcing from BRAG (Black Retail Action Group) – A nonprofit dedicated to advancing Black and BIPOC professionals in fashion, retail, and related industries through mentorship, scholarships, and career development. | https://assets.tapestry.com/tapestrycorp/assets/docs/2024/TAPESTRY-FY2024-CR-REPORT.pdf | https://assets.tapestry.com/tapestrycorp/assets/docs/2023/Tapestry_Inc_EEO1_Consolidated_2023.pdf | |||||||
| Target | Target | Yes | 15.8 | 13.1 | 10.0 | 5.9 | 16.7 | No | 0 | 0 | Not Reported | 0 | Yes | Target and Target Foundation donated more than 333 million in 2023, of which more than 183 million benefited underrepresented communities in the U.S., more than 322 million supported organizations and programs with local community impact, and more than 4 million funded disaster preparedness and response. | ||||||||||||||||
| The Walt Disney Company | Disney, Hulu, ABC, ABC News, Marvel, Onyx | 3/6/2025 | 8.0 | 5.6 | 7.0 | 13.3 | 10.0 | No | Yes | Yes | 817,800,000 | 0 | Not Reported | 14,500,000 | 99% | Yes | Black Business Employee Resource Group | No | In fiscal 2023, more than $145 million (~62%) of our total charitable giving of more than $235 million was directed to programs that support Asian American and Pacific Islander, Black and African American, Hispanic and Latino, Native American and Indigenous, multicultural, women, veterans, People with Disabilities, and LGBTQIA+ communities. | In fiscal 2023, Tier 1 spend was $817.8 million and Tier 2 spend was $236.3 million -- totaling $1,054,100,000. | $1M in grants Contributed in celebration of the theatrical release of Marvel Studios’ Black Panther: Wakanda Forever to nonprofits working to reduce the gender gap in technology | Supporting the National Black Business Pitch contest and mentoring program, organized by Women’s Business Enterprise Council West | Disney on the Yard helps to build a long-term pipeline of Black talent, expand access to opportunities for students from Historically Black Colleges and Universities (HBCUs) within the entertainment industry, and build a community for HBCU alumni across the company. Through its Innovation Challenge, students pitch their innovative ideas, receive mentorship, and can win scholarships (shown above). In 2023, Walt Disney World Resort hosted the HBCU Week Foundation’s largest HBCU Week event to date, with thousands of high school students attending, as well as HBCU representatives and corporate sponsors. | https://impact.disney.com/app/uploads/2024/03/2023-SSI-Report-4.pdf | https://impact.disney.com/app/uploads/2023/12/FY23-Diversity-Dashboard-Workforce.pdf | |||||
| TJX | TJ Max, Marshalls, HomeGoods, Sierra, HomeSense | 3/3/2025 | 17.1 | 14.1 | 0.0 | 0.0 | 10.0 | No | Yes | Yes | 0 | 0 | Not Reported | 0 | Yes | Yes | BLAC (Black Leadership & Associate Coalition) | No | Long-standing partnerships with communitybased non-profit organizations—such as a third-party leadership academy designed for Black executives and early- to mid-career managers in the U.S. and Canada—to create access to external support or professional development programs for our diverse Associates. | In the U.S., TJX has partnered with a number of nonprofits, including Leadership Enterprise for a Diverse America, and the United Negro College Fund (UNCF) to support their work in helping connect high school and college students with internship and early career opportunities. | https://www.tjx.com/docs/default-source/corporate-responsibility/tjx-2024-global-corporate-responsibility-report.pdf?sfvrsn=54a00e39_2 | https://www.tjx.com/docs/default-source/corporate-responsibility/2023-tjx-equal-employment-opportunity-eeo-1-report.pdf?sfvrsn=fc4932_1 | ||||||||
| Toyota | Lexus, Toyota | 3/3/2025 | Yes | 0.0 | 0.0 | 12.3 | 14.3 | 0.0 | No | Yes | Yes | 0 | 0 | Not Reported | 0 | Not Reported | Not Reported | African American Collaborative | No | Practical Leadership Training: Members of three Toyota Business Partnering Groups (BPGs)— African American Collaborative (AAC), Toyota Organization for the Development of Latinos (TODOS) and Toyota Asian American Society in Alliance (TAASiA)—participated in this unique training program for mid-career managers. | 35 out of 135 of Toyota/Lexus Diverse Dealers are African American. 38% of Toyota Lexus Minority Owners Dealership Association (TLMODA) Member Dealerships are Black-owned. | https://www.toyota.com/content/dam/tusa/environmentreport/downloads/2024NAER_Final.pdf | https://www.toyota.com/content/dam/tusa/environmentreport/downloads/2023NAER_Final.pdf | https://toyotaeffect.com/2024-d-i-annual-report/ | ||||||
| Trader Joe's | Trader Joe's | 3/3/2025 | 0.0 | 0.0 | 200.0 | 200.0 | 200.0 | No | Not Reported | Not Reported | 0 | 0 | Not Reported | 0 | Not Reported | Not Reported | Not Reported | No | ||||||||||||
| Uber | Uber | 3/3/2025 | 8.2 | 4.2 | 7.4 | 9.1 | 9.1 | No | Yes | Not Reported | 0 | 0 | Not Reported | 0 | 99% | Not Reported | Black at Uber | No | 17.9% of Uber drivers are Black. | Community Partner of AfroTech: The largest Black tech conference globally, AfroTech, saw more than 25,000 attendees at its 2023 event. A delegation of 50+ colleagues from 10 business functions along with executive and senior leaders represented Uber. Our US and Canada Mobility Operations and DEI teams partnered to bring Uber Charter to the conference. We also hosted opportunities for industry leaders to network and champion meaningful change. Additionally, in partnership with JET magazine, Uber published a special digital and physical issue telling the stories of Uber’s global network of Black leaders, employees, merchants, drivers, and couriers and celebrating their contributions. | Black people represented 10.4% of Uber's new hires. | https://s23.q4cdn.com/407969754/files/doc_downloads/2024/04/Uber-2024-Environmental-Social-and-Governance-Report.pdf | https://s23.q4cdn.com/407969754/files/doc_downloads/2024/09/Uber-2023-EEO-1-Report.pdf | |||||||
| Under Armour | Under Armour | 3/3/2025 | 0.0 | 0.0 | 200.0 | 0.0 | 11.1 | No | Not Reported | Not Reported | 0 | 0 | Not Reported | 0 | Not Reported | Yes | Black Employees Achieving Together (B.E.A.T.) | No | In February 2023, we reaffirmed on our commitment to support over 7,000 Baltimore City High School student athletes in an effort to pro- vide consistent access and opportunity both on and off the field. Along with our partners, we are continuing to unlock opportunities and pro- vide these student athletes an avenue to unlock their optimal perfor- mance—through uniforms, facility renovation, leadership development and academic support. | February 2024, Under Armour is released a product collection inspired by its athletes of color at the collegiate level. Designed around the legacy of African American quilting and inspired by HBCU athletes, the collection is aimed at amplifying Black voices and the brand’s ongoing commitment to empowering Black athletes year-round. | Under Armour provided scholarships to students through the HBCU Career Combine. This program includes opportunities to learn the business, network with top UA talent, and develop leadership skills for success. | https://about.underarmour.com/en-us/Purpose/Sustainability/2023-sustainability-and-impact-report.html | ||||||||
| Unilever | Axe, Ben & Jerry's Clear, Cif, Closeup, Comfort, Cornetto, Dermalogica, Dove, Hellman's, Knorr, Lux, Liquid IV, Magnum, Nutrafol, OMO, Pond's, Paula's Choice, Pepsodent, Radiant, Rexona, Sunlight, Sunsilk, Surf, Tresemme, Vaseline, Wall's | 3/6/2025 | 0.0 | 0.0 | 200.0 | 7.1 | 0.0 | No | Yes | Not Reported | 1,187,675,500 | 0 | Not Reported | 0 | Not Reported | Not Reported | Not Reported | No | The inequality in incomes, assets and opportunities between Black and white households in the US is known as the racial wealth gap, and currently stands at over $11 trillion. That is unacceptable. Our model achieves this by approaching procurement in two ways: first, we source key raw ingredients from cooperatives in West Africa that provide women with premium wages and job development opportunities. Second, we prioritise partnerships with Black-owned businesses, especially in marketing, where they represent nearly a quarter of our total spend. | Designing a more inclusive product portfolio is at the heart of our efforts to better meet our consumers’ needs. Our Nexxus Curl Define line, for instance, is based on a decade of research that shows the protein composition of curly and coily hair is different than that of straight hair. This research enabled us to develop targeted products like our SulfateFree Curl Define Shampoo, which won an Essence Magazine Best of Black Beauty award in 2021. | Together with National Urban League, Color Of Change and Western Center on Law & Poverty, Dove co-founded a coalition to help pass the CROWN Act to prohibit race-based discrimination in the workplace and schools. The CROWN Act (Creating a Respectful and Open World for Natural hair) was signed into law in California in July 2019. Since then, the CROWN Act or similar legislation has been passed in over 20 states and 50+ municipalities in the US. But our work does not stop: Dove continues to raise awareness by launching new campaigns like ‘As Early As Five’, in response to a second study which revealed Black girls experienced race-based hair discrimination as early as five years old. | We’re a founding member of the World Economic Forum’s Partnering for Racial Justice in Business initiative. This was launched in 2021 with a key objective of tackling racism in the workplace. Companies must put racial and ethnic justice on their boards’ agendas, take at least one firm action and set a long-term strategy to become an anti-racist organisation. | Vaseline® See My Skin - The only database designed to search for conditions on skin of color and connect patients with Dermatologists who understand their skin care needs | https://www.unilever.com/files/92ui5egz/production/b09c3510ee7cec58440d5f044f02bdefe85aa186.pdf | https://www.unilever.com/files/92ui5egz/production/7389005665eb8d074779b226bb4a8c4117786a2f.pdf | |||||
| United Airlines | United Airlines | 14.8 | 0.0 | 6.0 | 12.5 | 25.0 | No | Yes | Not Reported | 497,000,000 | 0 | Not Reported | 0 | Yes | Black - BEACON (Black Excellence Amplified Continuously in Our Network) | Yes | 817+ students from low-income and underrepresented backgrounds flown to 3 countries for transformative international travel experiences with our partner Global Glimpse | Supported diverse future aviation leaders through the Thurgood Marshall College Fund, Hispanic College Fund and Asian Pacific Islander American Scholars with financial contributions and representation at college job fairs to ensure the company has access to the best and most diverse future talent | Partnered with Chase and VISA on three promotions supporting Black History Month, Pride Month and Hunger Awareness which collectively raised $1,483,226 | https://crreport.united.com/documents/United-2023-CR-Report.pdf?dateUpdated=20241217 | ||||||||||
| United Parcel Service | UPS | 3/5/2025 | 23.0 | 20.7 | 16.1 | 12.5 | 25.0 | No | Yes | Yes | 3,500,000,000 | 0 | Not Reported | 150,000 | Not Reported | Not Reported | African American Business Resource Group | No | 342K volunteer hours recorded for underserved Black communities | 2023: Provided $150,000 in small business funding for three fashion brands from Historically Black Colleges and Universities (HBCUs) to unveil new collections on the runway. | https://about.ups.com/content/dam/upsstories/images/our-impact/reporting/2024-UPS-GRI-Report.pdf | https://about.ups.com/content/dam/upsstories/images/our-impact/ups-sustainability-and-social-impact-report/2023-Sustainability-Report-03-20-2024.1.pdf | https://about.ups.com/content/dam/upsstories/images/social-impact/reporting/2023-reporting/2023-EEO-1-Consolidated-Report.pdf | |||||||
| Verizon | Verizon | 3/6/2025 | 19.4 | 13.3 | 9.2 | 18.2 | 27.3 | No | Yes | Yes | 1,000,000,000 | 0 | Not Reported | 0 | 100% | Yes | BOLD (Black Originators, Leaders and Doers) | Yes | In 2023, Verizon spent $6.1 billion in goods and services directly and indirectly with diverse suppliers, including businesses 51% owned, operated and controlled by people of color, women, veterans, service-disabled veterans, LGBTQ+ and people with disabilities. | Verizon partners with many diversity-focused organizations to build our employer brand and recruit diverse talent, including AfroTech; National Society of Black Engineers. We post open positions on diversityfocused third-party platforms, such as HBCUConnect, in addition to traditional job sites | Verizon Innovative Learning STEM Achievers offers middle school students project-based STEM learning experiences in 3D design and printing, coding and app development, AR and VR and more through summer sessions and year-round workshops. The program is held in partnership with the National Association for Community College Entrepreneurship on the campuses of Historically Black Colleges and Universities, Hispanic-Serving Institutions and community colleges across the country. Students are paired with mentors, exposing them to career opportunities in STEM, technology and entrepreneurship. | We partner with the Campaign for the Fair Sentencing of Youth (CFSY) to support the human dignity and prosperity of people who were initially sentenced as children to life in prison and who are now returning to their communities. To further our work to connect these individuals to job training, employment and skill development, Verizon employees offer mentorship and training through our ADVANCE (Advocates for Disability, Accessibility, Neurodiversity and Caregiver Empowerment) and BOLD (Black Originators, Leaders and Doers) ERGs. | https://www.verizon.com/about/sites/default/files/2024-07/2023-EEO1-Type2.pdf | |||||||
| Walgreens Boots Alliance | Walgreens | 19.3 | 11.5 | 19.2 | 20.0 | 8.3 | No | Yes | Yes | 544,000,000 | 0 | Not Reported | 0 | Walgreens engages in flu equity outreach, including partnerships with community organizations, historically Black colleges and universities and federally qualified health centers, to help address vaccine hesitancy. At the start of fiscal 2024 and this past flu season, Boots administered 610,000 free flu vaccinations on behalf of the NHS for those eligible. | Black Young Professionals Network Boots and No7 Beauty Company are working with BYP Network to highlight career opportunities across the business with the aim of increasing representation of Black talent, where the data suggests the businesses could be more reflective of the local communities. | Skills for Chicagoland’s Future For the past decade, Walgreens has supported Skills for Chicagoland’s Future, a nonprofit organization connecting overlooked job seekers to employment in Chicago. As part of its partnership, Walgreens has committed to a strategic recruiting relationship to connect unemployed and underemployed individuals to opportunities at Walgreens. In fiscal 2024, 18 team members were hired, resulting in over 500 hires to date, including pharmacy technician apprentices, shift leaders and customer associates. | In fiscal 2024, Vitamin Angels and Walgreens announced the expansion of their Prenatal Vitamin Program to over 2,600 Walgreens stores nationwide, including a direct ship option in certain markets. The program provides free prenatal vitamins and minerals with nutrition education materials to pregnant women in underserved communities through participating Walgreens pharmacies across all 50 U.S. states. The program originally launched in the South and West Side of Chicago in fiscal 2021. Over the last three years, the program has continued to expand reaching over 18,000 women in need. To aid the domestic program Walgreens hosted a July donation event where $7.8 million was raised. | Pharmacy Inclusion Scholarship Program This program is designed to support pharmacy schools that are providing underrepresented minority students with positive educational experiences, while also increasing enrollment by underrepresented minority students. Over 290 students received scholarships through the program. | https://www.walgreensbootsalliance.com/sites/www/files/2025-01/Impact-Report-2024.pdf | https://www.walgreensbootsalliance.com/file-download/download/public/41521 | ||||||||||
| Walmart | Walmart, Sam's Club | Yes | 20.7 | 14.5 | 9.5 | 0.0 | 8.3 | No | 13,000,000,000 | 0 | Not Reported | Yes | ||||||||||||||||||
| Wells Fargo | Wells Fargo | 3/6/2025 | Yes | 13.5 | 10.3 | 6.3 | 12.5 | 23.1 | No | Not Reported | Not Reported | 0 | 0 | Not Reported | 99% | Black African American Connection | Yes | Compass Working Capital: With a $3.45 million multiyear grant commitment, Wells Fargo became a leading funder of the strategic growth campaign for Compass Working Capital, a leader in leveraging the federal Family Self-Sufficiency program to help improve the financial health of families living in public and subsidized housing. | Establishing the Communities Reimagining Energy (CoRE) initiative at the National Renewable Energy Laboratory (NREL) In addition to providing grants directed to local organizations, we also support the development of studies and research frameworks for key national intermediaries. With our support NREL launched its CoRE initiative, a first-of-its-kind hub for inclusive and equitable research that seeks to provide support to low-income communities as they build and pursue energy-transition strategies. NREL’s work with these communities will also help to inform its broader efforts, especially around applied clean energy research and innovation. | The Wells Fargo Foundation expanded its commitment to housing affordability through another $20 million competition with Enterprise Community Partners to find housing solutions focused on three categories: financing, construction, and access and resident support. The winning solutions included a workforce training program that prepares students for homeownership; a new way of financing housing in rural communities like the Mississippi Delta; and a new construction technology that reduces the carbon footprint of multifamily buildings. | With a grant awarded by the Wells Fargo Foundation, Larta Institute successfully established itsVenture Fellows program, which sources cleantech innovations directly from entrepreneurs in underserved communities. The program aims to help diverse innovators scale their ideas and help their communities become more resilient in response to the impacts of climate change. In its first year, the Venture Fellows program supported 14 early-stage startups with technical assistance, mentoring, access to capital, and legal services. | The Community Reinvestment Fund,USAused a Wells Fargo Open for Business grant to successfully launch its Small Business Resource Navigator, an online portal helping connect small- business owners to potential financing options and technical assistance through Community Development Financial Institutions (CDFIs) across the United States. Since its launch, the Small Business Resource Navigator has introduced nearly 2,500 small businesses to CDFIs for potential credit opportunities and technical assistance services. This online tool simplifies and streamlines the capital process for entrepreneurs, helping them quickly and effectively identify potential options. | https://www08.wellsfargomedia.com/assets/pdf/about/corporate-responsibility/sustainability-and-governance-report.pdf | https://www.wellsfargo.com/assets/pdf/about/corporate-responsibility/2023-eeo1-data.pdf | ||||||
| Wendy's | Wendy's | 3/3/2025 | 29.0 | 11.0 | 7.0 | 0.0 | 9.1 | No | Not Reported | Not Reported | 0 | 0 | Not Reported | 5,000 | Not Reported | Not Reported | Wendy's Black Employee Resource Group (WeBERG) | No | Thurgood Marshall College Fund (TMCF): Wendy’s was a sponsor of the Thurgood Marshall College Fund Leadership Institute and participated in the organization’s job fair. During the event, we interviewed and offered internship opportunities to students in IT, Finance, HR and Operations. In our fifth year of partnership, Wendy’s continues to donate to TMCF in support of social justice, youth and education in the Black community. | Central Intercollegiate Athletic Association (CIAA): The CIAA is one of America's oldest athletic conferences, originally formed to help organize athletic competitions between African American colleges. Today, the conference emphasizes academic success, recognizing student-athletes annually, providing scholarships and fostering total student-athlete well-being both on and off the court. In 2023, Wendy’s sponsored the CIAA Men’s and Women’s Basketball Tournament, celebrating the strong culture created by students and fans. During the event, Dr. Beverly Stallings-Johnson, Wendy’s Chief Diversity, Equity & Inclusion Officer, Stephanie Shaw, Wendy’s Vice President, Enterprise Technology, and Rasheeda Clark, President of Wendy's franchisee Wend American Group, spoke with student athletes about showing up authentically every day and the importance of owning your opportunity – on the court and beyond. | In 2023, Wendy’s donated nearly $110,000 to 23 organizations in the U.S., Canada and the United Kingdom. All seven ERGs received a $5,000 grant to support an organization aligned to the ERG’s mission. | https://www.wendys.com/sites/default/files/2024-05/Wendys-2023-Corporate-Responsibility-Report.pdf | ||||||||
| Wyndham | Registry Collection Hotels, Dolce Hotels & Resorts, Esplendor, Dazzler, Vienna House, Tryp, TM Trademark Collection, Alltra, La Quinta, Wingate, Hawthorn Extended Stay, AmericInn, Baymont, Ramada, Microtel, Days Inn, Super 8, Howard Johnson, Travelodge, Waterwalk | 3/3/2025 | 7.0 | 0.0 | 200.0 | 9.1 | 12.5 | No | Yes | Not Reported | 85,000,000 | 0 | Not Reported | 0 | Yes | Not Reported | Spectrum | No | Our BOLD by Wyndham program is designed to engage and advance more Black entrepreneurs on their path to hotel ownership. Developed with insight and support from existing and aspiring Black hoteliers, BOLD, which stands for Black Owners and Lodging Developers, aims to expand awareness for the unique challenges faced by Black entrepreneurs while using the scale and resources of Wyndham to help address those challenges and increase the number of Black hoteliers. The National Association of Black Hotel Owners, Operators and Developers (NABHOOD) reports that Black employment in the hotel industry represents nearly 20% of all team members in the industry, yet, less than 2% of hotel owners are Black. We designed BOLD to help advance existing and aspiring Black hotel owners to overcome barriers and achieve their ownership goals -- To date has resulted in 28 contracts signed. | 3% of Black people represent Management (defined as M, SM, VP, SVP, EVP & EC bands). | https://d1io3yog0oux5.cloudfront.net/_4210de66816a0d012fbce0faa9ecc281/wyndhamhotels/db/2300/20907/document/2024+ESG+Report+06042024+FINAL.pdf | |||||||||
| Yum! | KFC, Pizza Hut, Taco Bell, Habit Burger & Grill | 3/3/2025 | 20.6 | 10.7 | 5.8 | 21.4 | 18.2 | No | Yes | Not Reported | 0 | 0 | Not Reported | 0 | Yes | Yes | Not Reported | 2 of th 4 Yum! sub-brand CEOs are Black: Taco Bell and Pizza Hut | Technical apprenticeships offered through a OneTen and Multiverse pilot program for restaurant employees to build skills and transition into full-time corproate roles. In 2023, there were 15 participants with 63% moving into corporate roles. | Partnership between McKinsey and our Equity, Inclusion and Belonging (EIB) team that allows junior to senior-level employees to complete leadership training and courses—with 150 individuals across our global workforce doing so in 2023 | The Center launched the annual Yum! Franchise Accelerator Fellowship in 2022, a collaborative effort between the University of Louisville, Howard University and Yum! Brands, which offers a unique opportunity for four MBA students from the two universities. Participants in the annual program are granted $10,000 scholarships and receive personalized training and mentorship from industry experts during an immersive educational journey centered around the franchise business model. Each accelerator program culminates in a pitch competition featuring a $10,000 cash prize, while establishing winners as top candidates for promising franchising careers. The Yum! Franchise Accelerator Fellowship is open to all eligible students regardless of race, color, national origin, sex, disability, or age. | https://www.yum.com/wps/wcm/connect/yumbrands/e0b6e0c9-8762-4d1f-95ee-64f6ea0569a5/R4GG-2023-FINAL-hi-res-v2.pdf?MOD=AJPERES&CVID=pdbers9 | https://www.yum.com/wps/wcm/connect/yumbrands/aea89b7e-ff2a-4c48-b89e-214b688412d7/YSR-30033+R4GG+2023_Workforce+Report_FINAL.pdf?MOD=AJPERES&CVID=p9EarDK | |||||||
| Nissan | Nissan, Infiniti | 3/3/2025 | Yes | 0.0 | 0.0 | 4.8 | 0.0 | 0.0 | No | Yes | Yes | 0 | 0 | Not Reported | 0 | Black employees of Nissan (BEN) | No | The Driving Force (TDF) introduces Historically Black Colleges and Universities (HBCU) students to career opportunities in the automotive space with a journalism and communications focus. The Nissan partnership with the Black Automotive Media Group (BAMG) has been extended for a third year at Jackson State University, serving more than 40 students through the collaboration. The INFINITI partnership continues for a second year at Tennessee State University, with more than 20 students served through the program. This 10-week field-credit academic program includes virtual training, mentoring sessions and in-person product experiences. TDF enhances career development for young devotees seeking guidance in the mobility sector and works toward improving the diversity and inclusion of Black journalists covering the industry | Nissan maintains a strategic partnership with EVNoire, a national award-winning organization focusing on e mobility best practices and e-mobility DEI. EVNoire informs underserved and traditionally marginalized communities about affordable and more energy sustainable vehicles and platforms. In August 2023, EVNoire’s co-founder and managing partner Terry Travis presented during the national Blacks in Technology conference (BITCON), held in Nashville, about the proliferation of electrification and its anticipated impact. More than 2,000 Black IT professionals, entrepreneurs, gamers and technology enthusiasts attending BITCOM had the opportunity to engage with the Nissan Ariya on site. | In collaboration with McKinsey, Nissan’s new Leadership Essentials Program offers diverse talent, specifically among the Asian, Black, Hispanic and Latine populations, an opportunity to enhance their leadership presence. In 2023, 103 employees participated in a three-month blended learning journey designed to build knowledge, shift mindsets and expand networks using the principles of team leadership, business leadership and self-leadership | Canton employees have invested more than 15,000 volunteer hours in central Mississippi since Nissan began manufacturing vehicles there in 2003. To celebrate its partnership in the community, the plant launched Summer of Service to enable employees to volunteer “on the clock.” This new initiative let the team support seven philanthropic organizations including Boys & Girls Clubs of Central Mississippi, Habitat for Humanity Mississippi Capital Area, Madison Countians Allied Against Poverty, Mississippi Children’s Museum, Mississippi Food Network, Mississippi Museum of Natural Science and Stewpot Community Services. As Nissan looks ahead to an electrified future and making our world a cleaner place, Summer of Service is also a chance to strengthen environmental and sustainability partnerships with local organizations that make our communities better places to live, work and play. | https://www.nissanusa.com/content/dam/Nissan/us/responsibility/diversity/pdf/2023-Nissan-Group-of-the-Americas-DEI-Report.pdf |